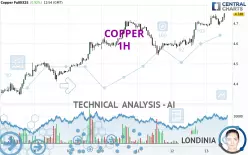
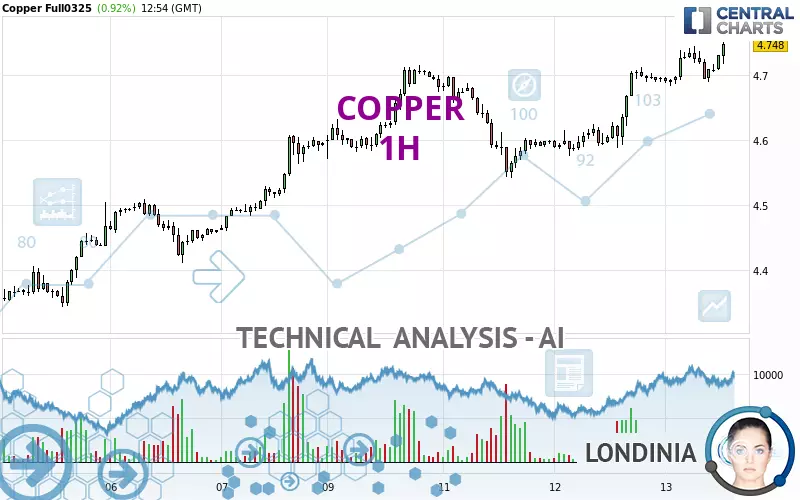
COPPER - 1H - Technical analysis published on 02/13/2025 (GMT)
- 104
- 0
Click here for a new analysis!
- Timeframe : 1H
- - Analysis generated on
- Status : INVALID
Summary of the analysis

Additional analysis
Quotes
The COPPER price is 4.7480 USD. On the day, this instrument gained +0.93% and was traded between 4.6835 USD and 4.7505 USD over the period. The price is currently at +1.38% from its lowest and -0.05% from its highest.A bearish opening was detected by the Central Gaps scanner. Sellers are trying to impose a bearish trend in the very short term.
Bearish opening
Type : Bearish
Timeframe : Openning
Here is a more detailed summary of the historical variations registered by COPPER:
New HIGH record (1st january)
Type : Bullish
Timeframe : Weekly
New HIGH record (1 month)
Type : Bullish
Timeframe : Weekly
Technical
Technical analysis of this 1H chart of COPPER indicates that the overall trend is strongly bullish. The signals given by the moving averages are 92.86% bullish. This strong bullish trend is confirmed by the strong signals currently being given by short-term moving averages. The Central Indicators scanner does not detect any result on moving averages that would impact this trend.
The probability of a further increase are moderate given the direction of the technical indicators.
Caution: the Central Indicators scanner currently detects an excess:
CCI indicator is overbought : over 100
Type : Neutral
Timeframe : 1 hour
Williams %R indicator is overbought : over -20
Type : Neutral
Timeframe : 1 hour
Parabolic SAR indicator bullish reversal
Type : Bullish
Timeframe : 1 hour
No signals are given by Central Patterns, a market scanner specialised in chart patterns, resistances and supports.
The Central Candlesticks scanner which studies Japanese candlesticks did not detect anything.
| S3 | S2 | S1 | Price | R1 | R2 | R3 | |
|---|---|---|---|---|---|---|---|
| ProTrendLines | 4.4410 | 4.5472 | 4.7237 | 4.7480 | 4.8947 | 5.0422 | 5.2402 |
| Change (%) | -6.47% | -4.23% | -0.51% | - | +3.09% | +6.20% | +10.37% |
| Change | -0.3070 | -0.2008 | -0.0243 | - | +0.1467 | +0.2942 | +0.4922 |
| Level | Major | Major | Major | - | Minor | Intermediate | Major |
Attention could also be paid to pivot points to set price objectives:
| Pivot points | S3 | S2 | S1 | PP | R1 | R2 | R3 |
|---|---|---|---|---|---|---|---|
| Standard | 4.4788 | 4.5272 | 4.6158 | 4.6642 | 4.7528 | 4.8012 | 4.8898 |
| Camarilla | 4.6668 | 4.6794 | 4.6919 | 4.7045 | 4.7171 | 4.7296 | 4.7422 |
| Woodie | 4.4990 | 4.5373 | 4.6360 | 4.6743 | 4.7730 | 4.8113 | 4.9100 |
| Fibonacci | 4.5272 | 4.5795 | 4.6118 | 4.6642 | 4.7165 | 4.7488 | 4.8012 |
| Pivot points | S3 | S2 | S1 | PP | R1 | R2 | R3 |
|---|---|---|---|---|---|---|---|
| Standard | 3.8878 | 4.0357 | 4.3123 | 4.4602 | 4.7368 | 4.8847 | 5.1613 |
| Camarilla | 4.4723 | 4.5112 | 4.5501 | 4.5890 | 4.6279 | 4.6668 | 4.7057 |
| Woodie | 3.9523 | 4.0679 | 4.3768 | 4.4924 | 4.8013 | 4.9169 | 5.2258 |
| Fibonacci | 4.0357 | 4.1978 | 4.2980 | 4.4602 | 4.6223 | 4.7225 | 4.8847 |
| Pivot points | S3 | S2 | S1 | PP | R1 | R2 | R3 |
|---|---|---|---|---|---|---|---|
| Standard | 3.5677 | 3.7863 | 4.0327 | 4.2513 | 4.4977 | 4.7163 | 4.9627 |
| Camarilla | 4.1511 | 4.1938 | 4.2364 | 4.2790 | 4.3216 | 4.3643 | 4.4069 |
| Woodie | 3.5815 | 3.7933 | 4.0465 | 4.2583 | 4.5115 | 4.7233 | 4.9765 |
| Fibonacci | 3.7863 | 3.9640 | 4.0737 | 4.2513 | 4.4290 | 4.5387 | 4.7163 |
Numerical data
The following is the status of technical indicators and moving averages registered at the time this technical analysis was created:
| RSI (14): | 62.20 | |
| MACD (12,26,9): | 0.0206 | |
| Directional Movement: | 10.2711 | |
| AROON (14): | 35.7143 | |
| DEMA (21): | 4.7239 | |
| Parabolic SAR (0,02-0,02-0,2): | 4.7397 | |
| Elder Ray (13): | 0.0073 | |
| Super Trend (3,10): | 4.6776 | |
| Zig ZAG (10): | 4.7180 | |
| VORTEX (21): | 1.2824 | |
| Stochastique (14,3,5): | 45.80 | |
| TEMA (21): | 4.7292 | |
| Williams %R (14): | -43.90 | |
| Chande Momentum Oscillator (20): | 0.0225 | |
| Repulse (5,40,3): | 0.1841 | |
| ROCnROLL: | 1 | |
| TRIX (15,9): | 0.0763 | |
| Courbe Coppock: | 1.16 |
| MA7: | 4.6036 | |
| MA20: | 4.4103 | |
| MA50: | 4.2805 | |
| MA100: | 4.3336 | |
| MAexp7: | 4.7122 | |
| MAexp20: | 4.6952 | |
| MAexp50: | 4.6605 | |
| MAexp100: | 4.6127 | |
| Price / MA7: | +3.14% | |
| Price / MA20: | +7.66% | |
| Price / MA50: | +10.92% | |
| Price / MA100: | +9.56% | |
| Price / MAexp7: | +0.76% | |
| Price / MAexp20: | +1.12% | |
| Price / MAexp50: | +1.88% | |
| Price / MAexp100: | +2.93% |
News
The last news published on COPPER at the time of the generation of this analysis was as follows:
-
 Copper Forecast December 10, 2024
-
Data Centers and EVs Need Copper. Invest Now?
-
Watch live: Train carrying copper crashed head on with passenger train in Santiago, Chile
-
Charting the markets: Copper to double? Central bank announcements and UK election effect on FX
-
Why Copper Demand Is Skyrocketing
About author

Online


Add a comment
Comments
0 comments on the analysis COPPER - 1H