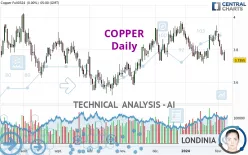
COPPER - Daily - Technical analysis published on 02/08/2024 (GMT)
- 150
- 0
Click here for a new analysis!
- Timeframe : Daily
- - Analysis generated on
- Status : TARGET REACHED

Summary of the analysis

Additional analysis
Quotes
The COPPER rating is 3.7605 USD. On the day, this instrument gained +0.67% with the lowest point at 3.7325 USD and the highest point at 3.7625 USD. The deviation from the price is +0.75% for the low point and -0.05% for the high point.So that you have an overall view of the price change, here is a table showing the variations over several periods:
Near a new LOW record (1 year)
Type : Bearish
Timeframe : Weekly
Near a new HIGH record (1st january)
Type : Bullish
Timeframe : Weekly
Near a new HIGH record (1 month)
Type : Bullish
Timeframe : Weekly
Technical
Technical analysis of this Daily chart of COPPER indicates that the overall trend is strongly bearish. The signals given by moving averages are 85.71% bearish. This strong bearish trend is confirmed by the strong signals currently being given by short-term moving averages. The Central Indicators market scanner currently does not detect any result that concerns moving averages.
In fact, 12 technical indicators on 18 studied are currently bearish. Caution: the Central Indicators scanner currently detects an excess:
RSI indicator: bullish divergence
Type : Bullish
Timeframe : Daily
Williams %R indicator is oversold : under -80
Type : Neutral
Timeframe : Daily
Pivot points : price is under support 1
Type : Neutral
Timeframe : Weekly
Central Patterns, the scanner specializing in chart patterns, did not identify any signals.
No result was found by the Central Candlesticks scanner on Japanese candlesticks.
| S3 | S2 | S1 | Price | R1 | R2 | R3 | |
|---|---|---|---|---|---|---|---|
| ProTrendLines | 3.6550 | 3.6910 | 3.7335 | 3.7605 | 3.8317 | 3.9595 | 4.0745 |
| Change (%) | -2.81% | -1.85% | -0.72% | - | +1.89% | +5.29% | +8.35% |
| Change | -0.1055 | -0.0695 | -0.0270 | - | +0.0712 | +0.1990 | +0.3140 |
| Level | Major | Minor | Major | - | Minor | Major | Intermediate |
To determine price objectives, it is also possible to use the pivot points. Here is the price position in relation to pivot points:
| Pivot points | S3 | S2 | S1 | PP | R1 | R2 | R3 |
|---|---|---|---|---|---|---|---|
| Standard | 3.6495 | 3.6905 | 3.7130 | 3.7540 | 3.7765 | 3.8175 | 3.8400 |
| Camarilla | 3.7180 | 3.7239 | 3.7297 | 3.7355 | 3.7413 | 3.7471 | 3.7530 |
| Woodie | 3.6403 | 3.6859 | 3.7038 | 3.7494 | 3.7673 | 3.8129 | 3.8308 |
| Fibonacci | 3.6905 | 3.7148 | 3.7297 | 3.7540 | 3.7783 | 3.7932 | 3.8175 |
| Pivot points | S3 | S2 | S1 | PP | R1 | R2 | R3 |
|---|---|---|---|---|---|---|---|
| Standard | 3.6458 | 3.7312 | 3.7763 | 3.8617 | 3.9068 | 3.9922 | 4.0373 |
| Camarilla | 3.7856 | 3.7976 | 3.8095 | 3.8215 | 3.8335 | 3.8454 | 3.8574 |
| Woodie | 3.6258 | 3.7211 | 3.7563 | 3.8516 | 3.8868 | 3.9821 | 4.0173 |
| Fibonacci | 3.7312 | 3.7810 | 3.8118 | 3.8617 | 3.9115 | 3.9423 | 3.9922 |
| Pivot points | S3 | S2 | S1 | PP | R1 | R2 | R3 |
|---|---|---|---|---|---|---|---|
| Standard | 3.4972 | 3.6058 | 3.7297 | 3.8383 | 3.9622 | 4.0708 | 4.1947 |
| Camarilla | 3.7896 | 3.8109 | 3.8322 | 3.8535 | 3.8748 | 3.8961 | 3.9174 |
| Woodie | 3.5048 | 3.6096 | 3.7373 | 3.8421 | 3.9698 | 4.0746 | 4.2023 |
| Fibonacci | 3.6058 | 3.6947 | 3.7495 | 3.8383 | 3.9272 | 3.9820 | 4.0708 |
Numerical data
The following is the status of the technical indicators and moving averages at the time of publication of this technical analysis:
| RSI (14): | 42.48 | |
| MACD (12,26,9): | -0.0108 | |
| Directional Movement: | -9.0597 | |
| AROON (14): | -35.7142 | |
| DEMA (21): | 3.8010 | |
| Parabolic SAR (0,02-0,02-0,2): | 3.9314 | |
| Elder Ray (13): | -0.0577 | |
| Super Trend (3,10): | 3.9061 | |
| Zig ZAG (10): | 3.7535 | |
| VORTEX (21): | 0.9690 | |
| Stochastique (14,3,5): | 13.48 | |
| TEMA (21): | 3.7877 | |
| Williams %R (14): | -90.02 | |
| Chande Momentum Oscillator (20): | -0.0400 | |
| Repulse (5,40,3): | -1.4202 | |
| ROCnROLL: | 2 | |
| TRIX (15,9): | -0.0043 | |
| Courbe Coppock: | 1.31 |
| MA7: | 3.8043 | |
| MA20: | 3.8066 | |
| MA50: | 3.8305 | |
| MA100: | 3.7695 | |
| MAexp7: | 3.7898 | |
| MAexp20: | 3.8114 | |
| MAexp50: | 3.8121 | |
| MAexp100: | 3.8124 | |
| Price / MA7: | -1.15% | |
| Price / MA20: | -1.21% | |
| Price / MA50: | -1.83% | |
| Price / MA100: | -0.24% | |
| Price / MAexp7: | -0.77% | |
| Price / MAexp20: | -1.34% | |
| Price / MAexp50: | -1.35% | |
| Price / MAexp100: | -1.36% |
News
The last news published on COPPER at the time of the generation of this analysis was as follows:
-
 Trade idea: Looking long on copper
-
Trade of the Week: short copper
-
Trading the Trend: Short copper
-
Inside Sweden’s copper mega-mine | DW News
-
Asiamet Resources pushing ahead into the bullish copper play
About author

Online


Add a comment
Comments
0 comments on the analysis COPPER - Daily