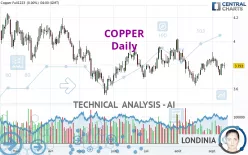
COPPER - Daily - Technical analysis published on 09/14/2023 (GMT)
- 194
- 0
Click here for a new analysis!
- Timeframe : Daily
- - Analysis generated on
- Status : TARGET REACHED

Summary of the analysis

Additional analysis
Quotes
The COPPER price is 3.7990 USD. The price has increased by +0.16% since the last closing and was between 3.7780 USD and 3.8215 USD. This implies that the price is at +0.56% from its lowest and at -0.59% from its highest.A bearish opening was detected by the Central Gaps scanner. Sellers are trying to impose a bearish trend in the very short term.
Bearish opening
Type : Bearish
Timeframe : Openning
Here is a more detailed summary of the historical variations registered by COPPER:
Near a new LOW record (1 month)
Type : Bearish
Timeframe : Weekly
Technical
Technical analysis of this Daily chart of COPPER indicates that the overall trend is bearish. The signals given by moving averages are 64.29% bearish. This bearish trend could slow down given the neutral signals currently being given by short-term moving averages. The Central Indicators scanner detects a bullish signal on moving averages that could impact this trend:
Bullish trend reversal : Moving Average 50
Type : Bullish
Timeframe : Daily
In fact, of the 18 technical indicators analysed by Central Analyzer, 5 are bullish, 9 are neutral and 4 are bearish. Other results related to technical indicators were also found by the Central Indicators scanner:
MACD crosses UP its Moving Average
Type : Bullish
Timeframe : Daily
Price is back over the pivot point
Type : Bullish
Timeframe : Daily
Price is back over the pivot point
Type : Bullish
Timeframe : Weekly
Momentum indicator is back under 0
Type : Bearish
Timeframe : Daily
No signals are given by Central Patterns, a market scanner specialised in chart patterns, resistances and supports.
No result was found by the Central Candlesticks scanner on Japanese candlesticks.
| S3 | S2 | S1 | Price | R1 | R2 | R3 | |
|---|---|---|---|---|---|---|---|
| ProTrendLines | 3.6002 | 3.6781 | 3.7873 | 3.7990 | 3.9003 | 4.0292 | 4.1808 |
| Change (%) | -5.23% | -3.18% | -0.31% | - | +2.67% | +6.06% | +10.05% |
| Change | -0.1988 | -0.1209 | -0.0117 | - | +0.1013 | +0.2302 | +0.3818 |
| Level | Major | Intermediate | Intermediate | - | Intermediate | Intermediate | Intermediate |
Pivot points can also be used to set your price objectives. Here is the price situation in relation to pivot points:
| Pivot points | S3 | S2 | S1 | PP | R1 | R2 | R3 |
|---|---|---|---|---|---|---|---|
| Standard | 3.7202 | 3.7453 | 3.7692 | 3.7943 | 3.8182 | 3.8433 | 3.8672 |
| Camarilla | 3.7795 | 3.7840 | 3.7885 | 3.7930 | 3.7975 | 3.8020 | 3.8065 |
| Woodie | 3.7195 | 3.7450 | 3.7685 | 3.7940 | 3.8175 | 3.8430 | 3.8665 |
| Fibonacci | 3.7453 | 3.7641 | 3.7756 | 3.7943 | 3.8131 | 3.8246 | 3.8433 |
| Pivot points | S3 | S2 | S1 | PP | R1 | R2 | R3 |
|---|---|---|---|---|---|---|---|
| Standard | 3.5002 | 3.6058 | 3.6612 | 3.7668 | 3.8222 | 3.9278 | 3.9832 |
| Camarilla | 3.6722 | 3.6870 | 3.7017 | 3.7165 | 3.7313 | 3.7460 | 3.7608 |
| Woodie | 3.4750 | 3.5933 | 3.6360 | 3.7543 | 3.7970 | 3.9153 | 3.9580 |
| Fibonacci | 3.6058 | 3.6673 | 3.7053 | 3.7668 | 3.8283 | 3.8663 | 3.9278 |
| Pivot points | S3 | S2 | S1 | PP | R1 | R2 | R3 |
|---|---|---|---|---|---|---|---|
| Standard | 3.3828 | 3.5157 | 3.6838 | 3.8167 | 3.9848 | 4.1177 | 4.2858 |
| Camarilla | 3.7692 | 3.7968 | 3.8244 | 3.8520 | 3.8796 | 3.9072 | 3.9348 |
| Woodie | 3.4005 | 3.5245 | 3.7015 | 3.8255 | 4.0025 | 4.1265 | 4.3035 |
| Fibonacci | 3.5157 | 3.6307 | 3.7017 | 3.8167 | 3.9317 | 4.0027 | 4.1177 |
Numerical data
The following is the status of the technical indicators and moving averages at the time of publication of this technical analysis:
| RSI (14): | 49.54 | |
| MACD (12,26,9): | -0.0067 | |
| Directional Movement: | -0.2484 | |
| AROON (14): | -35.7143 | |
| DEMA (21): | 3.7878 | |
| Parabolic SAR (0,02-0,02-0,2): | 3.8759 | |
| Elder Ray (13): | 0.0050 | |
| Super Trend (3,10): | 3.9242 | |
| Zig ZAG (10): | 3.7955 | |
| VORTEX (21): | 1.0863 | |
| Stochastique (14,3,5): | 41.54 | |
| TEMA (21): | 3.7896 | |
| Williams %R (14): | -57.61 | |
| Chande Momentum Oscillator (20): | -0.0435 | |
| Repulse (5,40,3): | 0.2944 | |
| ROCnROLL: | -1 | |
| TRIX (15,9): | -0.0302 | |
| Courbe Coppock: | 0.23 |
| MA7: | 3.7790 | |
| MA20: | 3.7968 | |
| MA50: | 3.8279 | |
| MA100: | 3.8190 | |
| MAexp7: | 3.7922 | |
| MAexp20: | 3.7977 | |
| MAexp50: | 3.8150 | |
| MAexp100: | 3.8400 | |
| Price / MA7: | +0.53% | |
| Price / MA20: | +0.06% | |
| Price / MA50: | -0.75% | |
| Price / MA100: | -0.52% | |
| Price / MAexp7: | +0.18% | |
| Price / MAexp20: | +0.03% | |
| Price / MAexp50: | -0.42% | |
| Price / MAexp100: | -1.07% |
News
The latest news and videos published on COPPER at the time of the analysis were as follows:
-
 Trade of the Week: short copper
-
Trading the Trend: Short copper
-
Inside Sweden’s copper mega-mine | DW News
-
Asiamet Resources pushing ahead into the bullish copper play
-
Asiamet Resources pushing head into the bullish copper play
About author

Online


Add a comment
Comments
0 comments on the analysis COPPER - Daily