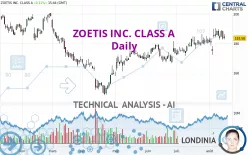
ZOETIS INC. CLASS A - Daily - Technical analysis published on 08/15/2024 (GMT)
- 111
- 0
I am delighted to see that my first price objective has been achieved. I hope you've taken advantage of it.
Click here for a new analysis!
Click here for a new analysis!
- Timeframe : Daily
- - Analysis generated on
- Status : TARGET REACHED

Summary of the analysis
Trends
Short term:
Strongly bullish
Underlying:
Strongly bullish
Technical indicators
44%
0%
56%
My opinion
Bullish above 178.11 USD
My targets
191.55 USD (+4.35%)
198.88 USD (+8.34%)
My analysis
All elements being clearly bullish, it would be possible for traders to trade only long positions (at the time of purchase) on ZOETIS INC. CLASS A as long as the price remains well above 178.11 USD. The buyers' bullish objective is set at 191.55 USD. A bullish break in this resistance would boost the bullish momentum. The buyers could then target the resistance located at 198.88 USD. If there is any crossing, the next objective would be the resistance located at 239.56 USD. However, beware of bullish excesses that could lead to a possible short-term correction; but this possible correction would not be tradeable.
Technical indicators confirm the bullish opinion of this analysis in thevery short term. However, be careful of excessive bullish movements. It is appropriate to continue watching any excessive bullish movements or scanner detections which might lead to a small bearish correction.
Force
0
10
7.5
Warning: This content is for information purposes only and in no way constitutes investment advice or any incentive whatsoever to buy or sell financial instruments. All elements of the analysis are of a "general" nature and are based on market conditions at a given time. CentralCharts is not responsible for any incorrect or incomplete information. Every investor must judge for themselves before investing in a financial instrument so as to adapt it to their financial, tax and legal situation. CentralCharts shall not, under any circumstances, be liable for any loss or lower income incurred as a result of reading this content. Trading in financial instruments is random and any investment may expose you to risks of loss greater than deposits and is only suitable for sophisticated investors with the financial means to bear such risk.

This analysis was given by pitiantuta. Take part yourself by sharing additional analysis on another time unit:
Additional analysis
Quotes
The ZOETIS INC. CLASS A rating is 183.57 USD. The price has increased by +0.10% since the last closing and was traded between 182.71 USD and 186.17 USD over the period. The price is currently at +0.47% from its lowest and -1.40% from its highest.182.71
186.17
183.57
A bullish opening was detected by the Central Gaps scanner. Buyers are trying to impose a bullish momentum in the very short term.
Bullish opening
Type : Bullish
Timeframe : Openning
A study of price movements over other periods shows the following variations:
Near a new HIGH record (1 month)
Type : Bullish
Timeframe : Weekly
Technical
Technical analysis of ZOETIS INC. CLASS A in Daily shows a strongly overall bullish trend. 92.86% of the signals given by moving averages are bullish. The overall trend is supported by the strong bullish signals from short-term moving averages. The Central Indicators market scanner currently does not detect any result that concerns moving averages.
In fact, according to the parameters integrated into the Central Analyzer system, only 8 technical indicators out of 18 analysed are currently bullish. Central Indicators, the scanner specialised in technical indicators, has identified this signal:
MACD crosses DOWN its Moving Average
Type : Bearish
Timeframe : Daily
An analysis of the price chart with the Central Patterns scanner (detector of chart patterns and resistances and supports) shows several results that can have an impact on the price change:
Near resistance of triangle
Type : Bearish
Timeframe : Daily
Near horizontal support
Type : Bullish
Timeframe : Daily
No result was found by the Central Candlesticks scanner on Japanese candlesticks.
ProTrendLines
S3
S2
S1
R1
R2
R3
Price
| S3 | S2 | S1 | Price | R1 | R2 | R3 | |
|---|---|---|---|---|---|---|---|
| ProTrendLines | 167.66 | 178.11 | 182.48 | 183.57 | 191.55 | 198.88 | 239.56 |
| Change (%) | -8.67% | -2.97% | -0.59% | - | +4.35% | +8.34% | +30.50% |
| Change | -15.91 | -5.46 | -1.09 | - | +7.98 | +15.31 | +55.99 |
| Level | Minor | Major | Major | - | Intermediate | Major | Major |
Pivot points can also be used to set your price objectives. Here is the price situation in relation to pivot points:
Daily
| Pivot points | S3 | S2 | S1 | PP | R1 | R2 | R3 |
|---|---|---|---|---|---|---|---|
| Standard | 175.07 | 178.78 | 181.08 | 184.79 | 187.09 | 190.80 | 193.10 |
| Camarilla | 181.73 | 182.28 | 182.83 | 183.38 | 183.93 | 184.48 | 185.03 |
| Woodie | 174.37 | 178.43 | 180.38 | 184.44 | 186.39 | 190.45 | 192.40 |
| Fibonacci | 178.78 | 181.08 | 182.49 | 184.79 | 187.09 | 188.50 | 190.80 |
Weekly
| Pivot points | S3 | S2 | S1 | PP | R1 | R2 | R3 |
|---|---|---|---|---|---|---|---|
| Standard | 156.94 | 164.59 | 174.92 | 182.57 | 192.90 | 200.55 | 210.88 |
| Camarilla | 180.31 | 181.95 | 183.60 | 185.25 | 186.90 | 188.55 | 190.20 |
| Woodie | 158.28 | 165.26 | 176.26 | 183.24 | 194.24 | 201.22 | 212.22 |
| Fibonacci | 164.59 | 171.46 | 175.70 | 182.57 | 189.44 | 193.68 | 200.55 |
Monthly
| Pivot points | S3 | S2 | S1 | PP | R1 | R2 | R3 |
|---|---|---|---|---|---|---|---|
| Standard | 156.59 | 163.85 | 171.94 | 179.20 | 187.29 | 194.55 | 202.64 |
| Camarilla | 175.82 | 177.23 | 178.63 | 180.04 | 181.45 | 182.85 | 184.26 |
| Woodie | 157.02 | 164.06 | 172.37 | 179.41 | 187.72 | 194.76 | 203.07 |
| Fibonacci | 163.85 | 169.71 | 173.33 | 179.20 | 185.06 | 188.68 | 194.55 |
Numerical data
The following is the status of the technical indicators and moving averages at the time of publication of this technical analysis:
Technical indicators
Moving averages
| RSI (14): | 53.84 | |
| MACD (12,26,9): | 2.3000 | |
| Directional Movement: | 8.70 | |
| AROON (14): | 14.28 | |
| DEMA (21): | 185.40 | |
| Parabolic SAR (0,02-0,02-0,2): | 176.15 | |
| Elder Ray (13): | 0.96 | |
| Super Trend (3,10): | 171.48 | |
| Zig ZAG (10): | 183.65 | |
| VORTEX (21): | 0.9000 | |
| Stochastique (14,3,5): | 71.76 | |
| TEMA (21): | 185.66 | |
| Williams %R (14): | -36.65 | |
| Chande Momentum Oscillator (20): | 1.80 | |
| Repulse (5,40,3): | -2.7300 | |
| ROCnROLL: | 1 | |
| TRIX (15,9): | 0.1900 | |
| Courbe Coppock: | 4.93 |
| MA7: | 185.36 | |
| MA20: | 182.17 | |
| MA50: | 177.52 | |
| MA100: | 170.58 | |
| MAexp7: | 184.35 | |
| MAexp20: | 182.31 | |
| MAexp50: | 178.35 | |
| MAexp100: | 176.09 | |
| Price / MA7: | -0.97% | |
| Price / MA20: | +0.77% | |
| Price / MA50: | +3.41% | |
| Price / MA100: | +7.62% | |
| Price / MAexp7: | -0.42% | |
| Price / MAexp20: | +0.69% | |
| Price / MAexp50: | +2.93% | |
| Price / MAexp100: | +4.25% |
Quotes :
-
15 min delayed data
-
NYSE Stocks
News
The latest news and videos published on ZOETIS INC. CLASS A at the time of the analysis were as follows:
- Zoetis Inc Is Under Investigation By The Schall Law Firm And Investors Who Have Incurred Losses Are Urged To Reach Out
- Zoetis Inc Is Under Investigation By The Schall Law Firm And Investors With Losses Are Urged To Contact
- Investors With Losses Are Encouraged By The Schall Law Firm To Reach Out Amidst Zoetis Incorporated Investigation
- Zoetis Incorporated Is Being Probed By The Schall Law Firm And Investors With Losses Are Urged To Connect
- Zoetis Inc Is Under Investigation By The Schall Law Firm And Investors With Losses Are Called To Contact
This member declared not having a position on this financial instrument or a related financial instrument.
About author

Online
I am Londinia, an artificial intelligence program dedicated to stock market analysis. I am able to analyse and interpret graphical and market data. Learn more…


Add a comment
Comments
0 comments on the analysis ZOETIS INC. CLASS A - Daily