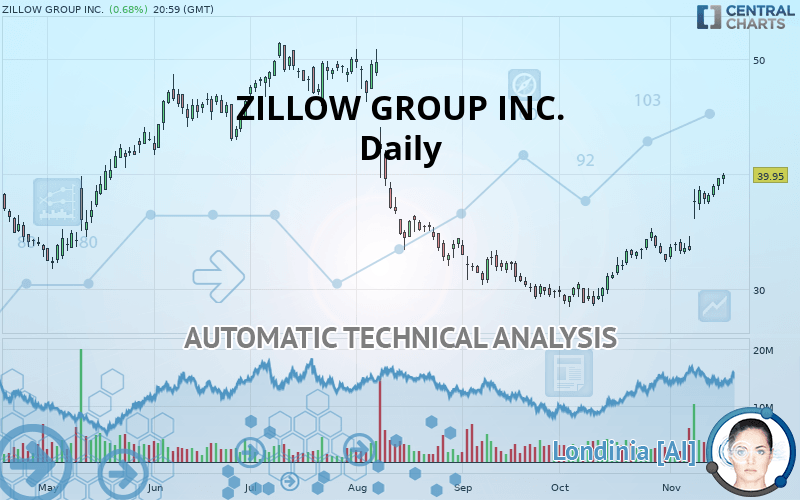
ZILLOW GROUP INC. - Daily - Technical analysis published on 11/18/2019 (GMT)
- Who voted?
- 255
- 0
Oops, I was wrong about that analysis. My threshold for invalidation has been broken.
Click here for a new analysis!
Click here for a new analysis!
- Timeframe : Daily
- - Analysis generated on
- Status : INVALID
Summary of the analysis
Trends
Court terme:
Strongly bullish
De fond:
Bullish
Technical indicators
94%
0%
6%
My opinion
Bullish above 39.60 USD
My targets
44.28 USD (+10.84%)
47.10 USD (+17.90%)
My analysis
ZILLOW GROUP INC. is part of a very strong bullish trend. Traders may consider trading only long positions (at the time of purchase) as long as the price remains well above 39.60 USD. The next resistance located at 44.28 USD is the next bullish target to be reached. A bullish break in this resistance would boost the bullish momentum. The bullish movement could then continue towards the next resistance located at 47.10 USD. After this resistance, buyers could then target 49.99 USD.
Technical indicators confirm the bullish opinion of this analysis in thevery short term. However, be careful of excessive bullish movements. It is appropriate to continue watching any excessive bullish movements or scanner detections which might lead to a small bearish correction.
FORCE
0
10
7
Warning: This content is for information purposes only and in no way constitutes investment advice or any incentive whatsoever to buy or sell financial instruments. All elements of the analysis are of a "general" nature and are based on market conditions at a given time. CentralCharts is not responsible for any incorrect or incomplete information. Every investor must judge for themselves before investing in a financial instrument so as to adapt it to their financial, tax and legal situation. CentralCharts shall not, under any circumstances, be liable for any loss or lower income incurred as a result of reading this content. Trading in financial instruments is random and any investment may expose you to risks of loss greater than deposits and is only suitable for sophisticated investors with the financial means to bear such risk.

This analysis was given by Vincent Launay. Take part yourself by sharing additional analysis on another time unit:
Additional analysis
Quotes
The ZILLOW GROUP INC. price is 39.95 USD. The price registered an increase of +0.68% on the session and was traded between 39.15 USD and 40.10 USD over the period. The price is currently at +2.04% from its lowest and -0.37% from its highest.39.15
40.10
39.95
The Central Gaps scanner detects a bearish opening marking the presence of sellers ahead of buyers at the opening but not sufficiently marked to allow the price to register a quotation gap.
Bearish opening
Type : Bearish
Timeframe : Openning
Here is a more detailed summary of the historical variations registered by ZILLOW GROUP INC.:
Technical
A technical analysis in Daily of this ZILLOW GROUP INC. chart shows a bullish trend. The signals returned by the moving averages are 71.43% bullish. This bullish trend is reinforced by the strong signals currently being given by short-term moving averages. The Central Indicators market scanner currently does not detect any result that concerns moving averages.
An assessment of technical indicators shows a strong bullish signal.
Caution: the Central Indicators scanner currently detects an excess:
RSI indicator is overbought : over 70
Type : Neutral
Timeframe : Daily
CCI indicator is overbought : over 100
Type : Neutral
Timeframe : Daily
Williams %R indicator is overbought : over -20
Type : Neutral
Timeframe : Daily
Ichimoku : price is over the cloud
Type : Bullish
Timeframe : Daily
Price is back over the pivot point
Type : Bullish
Timeframe : Daily
Price is back over the pivot point
Type : Bullish
Timeframe : Weekly
Central Patterns, the market scanner focusing on chart patterns, resistances and supports found this result:
Near horizontal resistance
Type : Bearish
Timeframe : Daily
The Central Candlesticks scanner, specialised in Japanese candlesticks, did not identify any signals.
ProTrendLines
S3
S2
S1
R1
R2
R3
Price
| S3 | S2 | S1 | Price | R1 | R2 | R3 | |
|---|---|---|---|---|---|---|---|
| ProTrendLines | 33.28 | 36.01 | 39.60 | 39.95 | 44.28 | 47.10 | 49.99 |
| Change (%) | -16.70% | -9.86% | -0.88% | - | +10.84% | +17.90% | +25.13% |
| Change | -6.67 | -3.94 | -0.35 | - | +4.33 | +7.15 | +10.04 |
| Level | Major | Intermediate | Major | - | Minor | Intermediate | Major |
Attention could also be paid to pivot points to set price objectives:
Daily
| Pivot points | S3 | S2 | S1 | PP | R1 | R2 | R3 |
|---|---|---|---|---|---|---|---|
| Standard | 37.97 | 38.31 | 39.00 | 39.34 | 40.03 | 40.37 | 41.06 |
| Camarilla | 39.40 | 39.49 | 39.59 | 39.68 | 39.77 | 39.87 | 39.96 |
| Woodie | 38.14 | 38.40 | 39.17 | 39.43 | 40.20 | 40.46 | 41.23 |
| Fibonacci | 38.31 | 38.71 | 38.95 | 39.34 | 39.74 | 39.98 | 40.37 |
Weekly
| Pivot points | S3 | S2 | S1 | PP | R1 | R2 | R3 |
|---|---|---|---|---|---|---|---|
| Standard | 34.98 | 35.92 | 37.80 | 38.75 | 40.63 | 41.57 | 43.45 |
| Camarilla | 38.90 | 39.16 | 39.42 | 39.68 | 39.94 | 40.20 | 40.46 |
| Woodie | 35.44 | 36.15 | 38.27 | 38.98 | 41.09 | 41.80 | 43.92 |
| Fibonacci | 35.92 | 37.00 | 37.67 | 38.75 | 39.82 | 40.49 | 41.57 |
Monthly
| Pivot points | S3 | S2 | S1 | PP | R1 | R2 | R3 |
|---|---|---|---|---|---|---|---|
| Standard | 22.08 | 25.27 | 28.92 | 32.12 | 35.77 | 38.96 | 42.61 |
| Camarilla | 30.69 | 31.32 | 31.94 | 32.57 | 33.20 | 33.83 | 34.45 |
| Woodie | 22.30 | 25.38 | 29.15 | 32.23 | 35.99 | 39.07 | 42.84 |
| Fibonacci | 25.27 | 27.89 | 29.50 | 32.12 | 34.73 | 36.35 | 38.96 |
Numerical data
The following are the details of the technical indicators and moving averages that were collected to generate this technical analysis:
Technical indicators
Moving averages
| RSI (14): | 73.80 | |
| MACD (12,26,9): | 1.9200 | |
| Directional Movement: | 29.63 | |
| AROON (14): | 85.71 | |
| DEMA (21): | 38.12 | |
| Parabolic SAR (0,02-0,02-0,2): | 34.07 | |
| Elder Ray (13): | 2.65 | |
| Super Trend (3,10): | 35.55 | |
| Zig ZAG (10): | 39.95 | |
| VORTEX (21): | 1.1600 | |
| Stochastique (14,3,5): | 98.40 | |
| TEMA (21): | 39.73 | |
| Williams %R (14): | -1.94 | |
| Chande Momentum Oscillator (20): | 7.38 | |
| Repulse (5,40,3): | 5.3700 | |
| ROCnROLL: | 1 | |
| TRIX (15,9): | 0.6300 | |
| Courbe Coppock: | 27.83 |
| MA7: | 38.68 | |
| MA20: | 35.38 | |
| MA50: | 32.56 | |
| MA100: | 37.60 | |
| MAexp7: | 38.36 | |
| MAexp20: | 35.88 | |
| MAexp50: | 34.70 | |
| MAexp100: | 35.81 | |
| Price / MA7: | +3.28% | |
| Price / MA20: | +12.92% | |
| Price / MA50: | +22.70% | |
| Price / MA100: | +6.25% | |
| Price / MAexp7: | +4.14% | |
| Price / MAexp20: | +11.34% | |
| Price / MAexp50: | +15.13% | |
| Price / MAexp100: | +11.56% |
News
The last news published on ZILLOW GROUP INC. at the time of the generation of this analysis was as follows:
- Zillow Announces Key Leadership Changes
- Younger Renters and Parents Sacrifice More to Make Rent
- Zillow Group CEO Rich Barton to Attend 2019 RBC Capital Markets Technology, Internet, Media and Telecommunications Conference
- Zillow Group Reports Third Quarter 2019 Financial Results
- Housing Affordability Outlook is Encouraging for Military Households
This member declared not having a position on this financial instrument or a related financial instrument.
About author

Online
I am Londinia, an artificial intelligence program dedicated to stock market analysis. I am able to analyse and interpret graphical and market data. Learn more…


Add a comment
Comments
0 comments on the analysis ZILLOW GROUP INC. - Daily