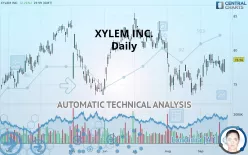
XYLEM INC. - Daily - Technical analysis published on 09/25/2019 (GMT)
- 305
- 0
- Who voted?
Click here for a new analysis!
- Timeframe : Daily
- - Analysis generated on
- Status : TARGET REACHED

Summary of the analysis

Additional analysis
Quotes
The XYLEM INC. rating is 78.56 USD. On the day, this instrument gained +2.21% and was traded between 76.71 USD and 78.68 USD over the period. The price is currently at +2.41% from its lowest and -0.15% from its highest.The Central Gaps scanner detects a bearish opening marking the presence of sellers ahead of buyers at the opening but not sufficiently marked to allow the price to register a quotation gap.
Bearish opening
Type : Bearish
Timeframe : Openning
So that you have an overall view of the price change, here is a table showing the variations over several periods:
Technical
Technical analysis of XYLEM INC. in Daily shows an overall slightly bullish trend. Only 53.57% of the signals given by moving averages are bullish. This slightly bullish trend is reinforced by the strong signals currently being given by short-term moving averages. The Central Indicators scanner detects bearish signals on moving averages that could impact this trend:
Bearish price crossover with Moving Average 20
Type : Bearish
Timeframe : Daily
Bearish price crossover with adaptative moving average 20
Type : Bearish
Timeframe : Daily
The technical indicators are bullish. There is still some doubt about the price increase.
Caution: the Central Indicators scanner currently detects an excess:
Williams %R indicator is overbought : over -20
Type : Neutral
Timeframe : Daily
Pivot points : price is over resistance 1
Type : Neutral
Timeframe : Daily
RSI indicator is back under 50
Type : Bearish
Timeframe : Daily
MACD crosses DOWN its Moving Average
Type : Bearish
Timeframe : Daily
Ichimoku : price is under the cloud
Type : Bearish
Timeframe : Daily
Price is back under the pivot point
Type : Bearish
Timeframe : Daily
Price is back under the pivot point
Type : Bearish
Timeframe : Weekly
Williams %R indicator is back under -50
Type : Bearish
Timeframe : Daily
An analysis of the price chart with the Central Patterns scanner (detector of chart patterns and resistances and supports) shows several results that can have an impact on the price change:
Resistance of channel is broken
Type : Bullish
Timeframe : Daily
Horizontal support is broken
Type : Bearish
Timeframe : Daily
The presence of a bearish pattern in Japanese candlesticks detected by Central Candlesticks that could cause a correction in the very short term was also detected:
Bearish engulfing lines
Type : Bearish
Timeframe : Daily
| S3 | S2 | S1 | Price | R1 | R2 | |
|---|---|---|---|---|---|---|
| ProTrendLines | 68.39 | 73.89 | 76.88 | 78.56 | 79.46 | 84.41 |
| Change (%) | -12.95% | -5.94% | -2.14% | - | +1.15% | +7.45% |
| Change | -10.17 | -4.67 | -1.68 | - | +0.90 | +5.85 |
| Level | Minor | Major | Major | - | Major | Intermediate |
Pivot points can also be used to set your price objectives. Here is the price situation in relation to pivot points:
| Pivot points | S3 | S2 | S1 | PP | R1 | R2 | R3 |
|---|---|---|---|---|---|---|---|
| Standard | 74.00 | 75.27 | 76.06 | 77.33 | 78.12 | 79.39 | 80.18 |
| Camarilla | 76.29 | 76.48 | 76.67 | 76.86 | 77.05 | 77.24 | 77.43 |
| Woodie | 73.77 | 75.15 | 75.83 | 77.21 | 77.89 | 79.27 | 79.95 |
| Fibonacci | 75.27 | 76.05 | 76.54 | 77.33 | 78.11 | 78.60 | 79.39 |
| Pivot points | S3 | S2 | S1 | PP | R1 | R2 | R3 |
|---|---|---|---|---|---|---|---|
| Standard | 74.99 | 76.14 | 76.81 | 77.96 | 78.63 | 79.78 | 80.45 |
| Camarilla | 76.98 | 77.15 | 77.31 | 77.48 | 77.65 | 77.81 | 77.98 |
| Woodie | 74.75 | 76.02 | 76.57 | 77.84 | 78.39 | 79.66 | 80.21 |
| Fibonacci | 76.14 | 76.84 | 77.27 | 77.96 | 78.66 | 79.09 | 79.78 |
| Pivot points | S3 | S2 | S1 | PP | R1 | R2 | R3 |
|---|---|---|---|---|---|---|---|
| Standard | 65.14 | 69.13 | 72.87 | 76.85 | 80.59 | 84.58 | 88.32 |
| Camarilla | 74.49 | 75.19 | 75.90 | 76.61 | 77.32 | 78.03 | 78.73 |
| Woodie | 65.02 | 69.07 | 72.75 | 76.79 | 80.47 | 84.52 | 88.20 |
| Fibonacci | 69.13 | 72.08 | 73.90 | 76.85 | 79.81 | 81.63 | 84.58 |
Numerical data
The following are the details of the technical indicators and moving averages that were collected to generate this technical analysis:
| RSI (14): | 55.28 | |
| MACD (12,26,9): | 0.2600 | |
| Directional Movement: | 0.43 | |
| AROON (14): | 35.71 | |
| DEMA (21): | 77.79 | |
| Parabolic SAR (0,02-0,02-0,2): | 79.28 | |
| Elder Ray (13): | -0.02 | |
| Super Trend (3,10): | 74.22 | |
| Zig ZAG (10): | 78.56 | |
| VORTEX (21): | 1.0400 | |
| Stochastique (14,3,5): | 51.61 | |
| TEMA (21): | 78.34 | |
| Williams %R (14): | -28.08 | |
| Chande Momentum Oscillator (20): | 1.06 | |
| Repulse (5,40,3): | 1.3400 | |
| ROCnROLL: | 1 | |
| TRIX (15,9): | 0.0400 | |
| Courbe Coppock: | 4.04 |
| MA7: | 77.87 | |
| MA20: | 77.46 | |
| MA50: | 77.54 | |
| MA100: | 78.24 | |
| MAexp7: | 77.84 | |
| MAexp20: | 77.53 | |
| MAexp50: | 77.68 | |
| MAexp100: | 77.72 | |
| Price / MA7: | +0.89% | |
| Price / MA20: | +1.42% | |
| Price / MA50: | +1.32% | |
| Price / MA100: | +0.41% | |
| Price / MAexp7: | +0.92% | |
| Price / MAexp20: | +1.33% | |
| Price / MAexp50: | +1.13% | |
| Price / MAexp100: | +1.08% |
News
The latest news and videos published on XYLEM INC. at the time of the analysis were as follows:
- Xylem to participate in the 2019 Morgan Stanley 7th Annual Laguna Conference
- Xylem to participate in the 2019 RBC Capital Markets Global Industrials Conference
- Xylem to participate in the 2019 Baltusrol Executive Summit
- Xylem and Planet Water Foundation Set to Bring Safe Drinking Water to Half a Million People Annually
- Xylem to participate in the Barclays 2019 Industrial Select Conference
About author

Online


Add a comment
Comments
0 comments on the analysis XYLEM INC. - Daily