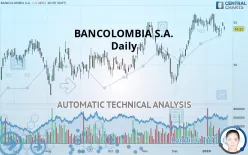
BANCOLOMBIA S.A. - Daily - Technical analysis published on 01/21/2020 (GMT)
- 307
- 0
- Who voted?
Click here for a new analysis!
- Timeframe : Daily
- - Analysis generated on
- Status : TARGET REACHED

Summary of the analysis

Additional analysis
Quotes
The BANCOLOMBIA S.A. price is 54.21 USD. On the day, this instrument gained -1.37% and was between 54.02 USD and 54.56 USD. This implies that the price is at +0.35% from its lowest and at -0.64% from its highest.The Central Gaps scanner detects the formation of a bearish gap marking the strong presence of sellers ahead of buyers at the opening. This formed a quotation gap.
Opening Gap DOWN
Type : Bearish
Timeframe : Openning
Here is a more detailed summary of the historical variations registered by BANCOLOMBIA S.A.:
Near a new HIGH record (5 years)
Type : Bullish
Timeframe : Weekly
Near a new HIGH record (1 year)
Type : Bullish
Timeframe : Weekly
Technical
Technical analysis of this Daily chart of BANCOLOMBIA S.A. indicates that the overall trend is bullish. The signals given by moving averages are 71.43% bullish. This bullish trend could slow down given the neutral signals currently being given by short-term moving averages. The Central Indicators market scanner is currently detecting several bullish signals that could impact this trend:
Bullish price crossover with Moving Average 20
Type : Bullish
Timeframe : Daily
Bullish price crossover with adaptative moving average 20
Type : Bullish
Timeframe : Daily
An assessment of technical indicators does not currently provide any relevant information on the direction of future price movements.
Central Indicators, the scanner specialised in technical indicators, has identified these signals:
Pivot points : price is under support 3
Type : Neutral
Timeframe : Daily
Price is back over the pivot point
Type : Bullish
Timeframe : Daily
Price is back over the pivot point
Type : Bullish
Timeframe : Weekly
Momentum indicator is back over 0
Type : Bullish
Timeframe : Daily
Williams %R indicator is back over -50
Type : Bullish
Timeframe : Daily
The Central Patterns scanner, which studies chart patterns, resistances and supports, has identified this signal:
Near support of channel
Type : Bullish
Timeframe : Daily
For a small rebound in the very short term, the Central Candlesticks scanner currently notes the presence of this bullish pattern in Japanese candlesticks:
Upside gap
Type : Bullish
Timeframe : Daily
| S3 | S2 | S1 | Price | R1 | R2 | R3 | |
|---|---|---|---|---|---|---|---|
| ProTrendLines | 46.39 | 48.31 | 52.83 | 54.21 | 55.14 | 65.88 | 70.50 |
| Change (%) | -14.43% | -10.88% | -2.55% | - | +1.72% | +21.53% | +30.05% |
| Change | -7.82 | -5.90 | -1.38 | - | +0.93 | +11.67 | +16.29 |
| Level | Minor | Major | Intermediate | - | Major | Minor | Intermediate |
Pivot points can also be used to set your price objectives. Here is the price situation in relation to pivot points:
| Pivot points | S3 | S2 | S1 | PP | R1 | R2 | R3 |
|---|---|---|---|---|---|---|---|
| Standard | 54.20 | 54.37 | 54.67 | 54.84 | 55.14 | 55.31 | 55.61 |
| Camarilla | 54.83 | 54.87 | 54.92 | 54.96 | 55.00 | 55.05 | 55.09 |
| Woodie | 54.26 | 54.40 | 54.73 | 54.87 | 55.20 | 55.34 | 55.67 |
| Fibonacci | 54.37 | 54.55 | 54.66 | 54.84 | 55.02 | 55.13 | 55.31 |
| Pivot points | S3 | S2 | S1 | PP | R1 | R2 | R3 |
|---|---|---|---|---|---|---|---|
| Standard | 52.18 | 52.76 | 53.86 | 54.44 | 55.54 | 56.12 | 57.22 |
| Camarilla | 54.50 | 54.65 | 54.81 | 54.96 | 55.11 | 55.27 | 55.42 |
| Woodie | 52.44 | 52.89 | 54.12 | 54.57 | 55.80 | 56.25 | 57.48 |
| Fibonacci | 52.76 | 53.40 | 53.80 | 54.44 | 55.08 | 55.48 | 56.12 |
| Pivot points | S3 | S2 | S1 | PP | R1 | R2 | R3 |
|---|---|---|---|---|---|---|---|
| Standard | 41.58 | 44.60 | 49.70 | 52.72 | 57.81 | 60.83 | 65.92 |
| Camarilla | 52.56 | 53.30 | 54.05 | 54.79 | 55.53 | 56.28 | 57.02 |
| Woodie | 42.62 | 45.12 | 50.73 | 53.24 | 58.85 | 61.35 | 66.96 |
| Fibonacci | 44.60 | 47.70 | 49.62 | 52.72 | 55.82 | 57.73 | 60.83 |
Numerical data
The following are the details of the technical indicators and moving averages that were collected to generate this technical analysis:
| RSI (14): | 51.65 | |
| MACD (12,26,9): | 0.4500 | |
| Directional Movement: | 2.39 | |
| AROON (14): | -28.57 | |
| DEMA (21): | 55.02 | |
| Parabolic SAR (0,02-0,02-0,2): | 55.15 | |
| Elder Ray (13): | -0.19 | |
| Super Trend (3,10): | 52.76 | |
| Zig ZAG (10): | 54.21 | |
| VORTEX (21): | 0.9800 | |
| Stochastique (14,3,5): | 40.82 | |
| TEMA (21): | 54.78 | |
| Williams %R (14): | -68.48 | |
| Chande Momentum Oscillator (20): | -1.01 | |
| Repulse (5,40,3): | 0.5600 | |
| ROCnROLL: | -1 | |
| TRIX (15,9): | 0.2000 | |
| Courbe Coppock: | 1.94 |
| MA7: | 54.29 | |
| MA20: | 54.79 | |
| MA50: | 52.67 | |
| MA100: | 51.42 | |
| MAexp7: | 54.45 | |
| MAexp20: | 54.28 | |
| MAexp50: | 53.14 | |
| MAexp100: | 51.93 | |
| Price / MA7: | -0.15% | |
| Price / MA20: | -1.06% | |
| Price / MA50: | +2.92% | |
| Price / MA100: | +5.43% | |
| Price / MAexp7: | -0.44% | |
| Price / MAexp20: | -0.13% | |
| Price / MAexp50: | +2.01% | |
| Price / MAexp100: | +4.39% |
News
The last news published on BANCOLOMBIA S.A. at the time of the generation of this analysis was as follows:
- Bancolombia Selects Unisys to Provide Enhanced Digital Workplace and Security Capabilities through InteliServe™ and Unisys Stealth®
- Bancolombia S.A. Announces Filing of the 2018 Annual Report on Form 20-F
-
 Gabriel Eduardo Di Lelle, vice-president of innovation and digital transformation, Bancolombia - Vie
- Bancolombia S.A. Announces Filing Of The 2017 Annual Report On Form 20-F
- Bancolombia S.A. Announces Filing of the 2016 Annual Report on Form 20-F
About author

Online


Add a comment
Comments
0 comments on the analysis BANCOLOMBIA S.A. - Daily