WIRECARD AG - Daily - Technical analysis published on 10/02/2019 (GMT)
- 383
- 0
- Who voted?
Click here for a new analysis!
- Timeframe : Daily
- - Analysis generated on
- Status : TARGET REACHED

Summary of the analysis
Additional analysis
Quotes
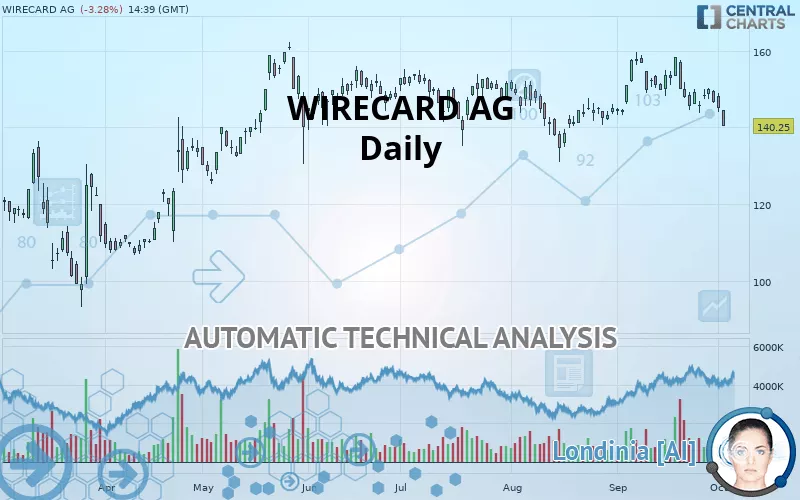
The WIRECARD AG rating is 140.25 EUR. On the day, this instrument lost -3.28% with the lowest point at 140.25 EUR and the highest point at 144.55 EUR. The deviation from the price is 0% for the low point and -2.97% for the high point.The Central Gaps scanner detects a bearish opening marking the presence of sellers ahead of buyers at the opening but not sufficiently marked to allow the price to register a quotation gap.
Bearish opening
Type : Bearish
Timeframe : Openning
Here is a more detailed summary of the historical variations registered by WIRECARD AG:
Technical
Technical analysis of WIRECARD AG in Daily shows an overall bearish trend. 64.29% of the signals given by moving averages are bearish. The overall trend is reinforced by the strong bearish signals from short-term moving averages. An assessment of moving averages reveals a bearish signal that could impact this trend:
Bearish trend reversal : adaptative moving average 100
Type : Bearish
Timeframe : Daily
Technical indicators are strongly bearish, suggesting that the price decline is expected to continue.
Caution: the Central Indicators scanner currently detects an excess:
CCI indicator is oversold : under -100
Type : Neutral
Timeframe : Daily
Williams %R indicator is oversold : under -80
Type : Neutral
Timeframe : Daily
Pivot points : price is under support 3
Type : Neutral
Timeframe : Daily
Pivot points : price is under support 3
Type : Neutral
Timeframe : Weekly
MACD indicator is back under 0
Type : Bearish
Timeframe : Daily
An analysis of the price chart with the Central Patterns scanner (detector of chart patterns and resistances and supports) shows several results that can have an impact on the price change:
Near support of channel
Type : Bullish
Timeframe : Daily
Near support of triangle
Type : Bullish
Timeframe : Daily
Horizontal support is broken
Type : Bearish
Timeframe : Daily
The Central Candlesticks scanner which studies Japanese candlesticks did not detect anything.
| S3 | S2 | S1 | Price | R1 | R2 | R3 | |
|---|---|---|---|---|---|---|---|
| ProTrendLines | 126.82 | 134.12 | 139.80 | 140.25 | 145.30 | 160.90 | 167.40 |
| Change (%) | -9.58% | -4.37% | -0.32% | - | +3.60% | +14.72% | +19.36% |
| Change | -13.43 | -6.13 | -0.45 | - | +5.05 | +20.65 | +27.15 |
| Level | Minor | Intermediate | Major | - | Intermediate | Major | Intermediate |
Pivot points can also be used to set your price objectives. Here is the price situation in relation to pivot points:
| Pivot points | S3 | S2 | S1 | PP | R1 | R2 | R3 |
|---|---|---|---|---|---|---|---|
| Standard | 138.12 | 141.13 | 143.07 | 146.08 | 148.02 | 151.03 | 152.97 |
| Camarilla | 143.64 | 144.09 | 144.55 | 145.00 | 145.45 | 145.91 | 146.36 |
| Woodie | 137.58 | 140.86 | 142.53 | 145.81 | 147.48 | 150.76 | 152.43 |
| Fibonacci | 141.13 | 143.02 | 144.19 | 146.08 | 147.97 | 149.14 | 151.03 |
| Pivot points | S3 | S2 | S1 | PP | R1 | R2 | R3 |
|---|---|---|---|---|---|---|---|
| Standard | 138.88 | 141.27 | 145.58 | 147.97 | 152.28 | 154.67 | 158.98 |
| Camarilla | 148.06 | 148.67 | 149.29 | 149.90 | 150.51 | 151.13 | 151.74 |
| Woodie | 139.85 | 141.75 | 146.55 | 148.45 | 153.25 | 155.15 | 159.95 |
| Fibonacci | 141.27 | 143.83 | 145.41 | 147.97 | 150.53 | 152.11 | 154.67 |
| Pivot points | S3 | S2 | S1 | PP | R1 | R2 | R3 |
|---|---|---|---|---|---|---|---|
| Standard | 123.60 | 133.45 | 140.10 | 149.95 | 156.60 | 166.45 | 173.10 |
| Camarilla | 142.21 | 143.73 | 145.24 | 146.75 | 148.26 | 149.78 | 151.29 |
| Woodie | 122.00 | 132.65 | 138.50 | 149.15 | 155.00 | 165.65 | 171.50 |
| Fibonacci | 133.45 | 139.75 | 143.65 | 149.95 | 156.25 | 160.15 | 166.45 |
Numerical data
The following is the status of the technical indicators and moving averages at the time of publication of this technical analysis:
| RSI (14): | 40.55 | |
| MACD (12,26,9): | -0.7900 | |
| Directional Movement: | -10.83 | |
| AROON (14): | -71.43 | |
| DEMA (21): | 147.40 | |
| Parabolic SAR (0,02-0,02-0,2): | 154.46 | |
| Elder Ray (13): | -4.88 | |
| Super Trend (3,10): | 155.78 | |
| Zig ZAG (10): | 140.75 | |
| VORTEX (21): | 0.8900 | |
| Stochastique (14,3,5): | 10.65 | |
| TEMA (21): | 146.02 | |
| Williams %R (14): | -98.33 | |
| Chande Momentum Oscillator (20): | -12.95 | |
| Repulse (5,40,3): | -6.2600 | |
| ROCnROLL: | 2 | |
| TRIX (15,9): | 0.0500 | |
| Courbe Coppock: | 8.40 |
| MA7: | 146.49 | |
| MA20: | 150.43 | |
| MA50: | 147.32 | |
| MA100: | 148.25 | |
| MAexp7: | 145.82 | |
| MAexp20: | 147.93 | |
| MAexp50: | 147.55 | |
| MAexp100: | 145.39 | |
| Price / MA7: | -4.26% | |
| Price / MA20: | -6.77% | |
| Price / MA50: | -4.80% | |
| Price / MA100: | -5.40% | |
| Price / MAexp7: | -3.82% | |
| Price / MAexp20: | -5.19% | |
| Price / MAexp50: | -4.95% | |
| Price / MAexp100: | -3.54% |
News
Don"t forget to follow the news on WIRECARD AG. At the time of publication of this analysis, the latest news was as follows:
- Wirecard Launches First Fully Digital Multi-merchant Loyalty Solution
- Wirecard Announces New Salesforce Commerce Cloud Integration
- Wirecard Announces New Salesforce Commerce Cloud Integration
- Wirecard Announces New Salesforce Commerce Cloud Integration
- Wirecard Wins Singapore's Most Popular Gourmet Restaurant Chain as a New Client for Digital Payments to Ensure a Seamless Customer Journey
About author

Online


Add a comment
Comments
0 comments on the analysis WIRECARD AG - Daily