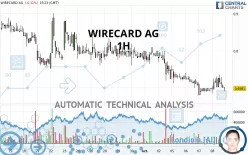
WIRECARD AG - 1H - Technical analysis published on 10/08/2020 (GMT)
- 292
- 0
- Who voted?
Click here for a new analysis!
- Timeframe : 1H
- - Analysis generated on
- Status : LEVEL MAINTAINED

Summary of the analysis
Additional analysis
Quotes
The WIRECARD AG price is 0.6981 EUR. The price is lower by -0.11% since the last closing and was traded between 0.6850 EUR and 0.7350 EUR over the period. The price is currently at +1.91% from its lowest and -5.02% from its highest.The Central Gaps scanner detects a bearish opening marking the presence of sellers ahead of buyers at the opening but not sufficiently marked to allow the price to register a quotation gap.
Bearish opening
Type : Bearish
Timeframe : Openning
A study of price movements over other periods shows the following variations:
Near a new LOW record (1 month)
Type : Bearish
Timeframe : Weekly
Technical
A technical analysis in 1H of this WIRECARD AG chart shows a sharp bearish trend. 92.86% of the signals given by moving averages are bearish. This strongly bearish trend is supported by the strong bearish signals given by short-term moving averages. The Central Indicators market scanner is currently detecting a bearish signal that could impact this trend:
Bearish price crossover with Moving Average 20
Type : Bearish
Timeframe : 1 hour
In fact, Central Analyzer took into account 18 technical indicators and the result was as follows: 6 are bullish, 7 are neutral and 5 are bearish. Central Indicators, the scanner specialised in technical indicators, has identified these signals:
RSI indicator is back under 50
Type : Bearish
Timeframe : 1 hour
Price is back under the pivot point
Type : Bearish
Timeframe : Weekly
An analysis of the price chart with the Central Patterns scanner (detector of chart patterns and resistances and supports) shows several results that can have an impact on the price change:
Near horizontal resistance
Type : Bearish
Timeframe : 1 hour
Resistance of channel is broken
Type : Bullish
Timeframe : 1 hour
The Central Candlesticks scanner which studies Japanese candlesticks did not detect anything.
| S1 | Price | R1 | R2 | R3 | |
|---|---|---|---|---|---|
| ProTrendLines | 0.6200 | 0.6981 | 0.6995 | 0.7600 | 0.9014 |
| Change (%) | -11.19% | - | +0.20% | +8.87% | +29.12% |
| Change | -0.0781 | - | +0.0014 | +0.0619 | +0.2033 |
| Level | Major | - | Minor | Intermediate | Intermediate |
Attention could also be paid to pivot points to set price objectives:
| Pivot points | S3 | S2 | S1 | PP | R1 | R2 | R3 |
|---|---|---|---|---|---|---|---|
| Standard | 0.6461 | 0.6631 | 0.6810 | 0.6980 | 0.7159 | 0.7329 | 0.7508 |
| Camarilla | 0.6893 | 0.6925 | 0.6957 | 0.6989 | 0.7021 | 0.7053 | 0.7085 |
| Woodie | 0.6466 | 0.6633 | 0.6815 | 0.6982 | 0.7164 | 0.7331 | 0.7513 |
| Fibonacci | 0.6631 | 0.6764 | 0.6847 | 0.6980 | 0.7113 | 0.7196 | 0.7329 |
| Pivot points | S3 | S2 | S1 | PP | R1 | R2 | R3 |
|---|---|---|---|---|---|---|---|
| Standard | 0.5693 | 0.6441 | 0.6841 | 0.7589 | 0.7989 | 0.8737 | 0.9137 |
| Camarilla | 0.6924 | 0.7030 | 0.7135 | 0.7240 | 0.7345 | 0.7451 | 0.7556 |
| Woodie | 0.5518 | 0.6354 | 0.6666 | 0.7502 | 0.7814 | 0.8650 | 0.8962 |
| Fibonacci | 0.6441 | 0.6880 | 0.7151 | 0.7589 | 0.8028 | 0.8299 | 0.8737 |
| Pivot points | S3 | S2 | S1 | PP | R1 | R2 | R3 |
|---|---|---|---|---|---|---|---|
| Standard | -0.4972 | 0.0469 | 0.4117 | 0.9558 | 1.3206 | 1.8647 | 2.2295 |
| Camarilla | 0.5265 | 0.6098 | 0.6931 | 0.7764 | 0.8597 | 0.9430 | 1.0264 |
| Woodie | -0.5870 | 0.0021 | 0.3220 | 0.9110 | 1.2309 | 1.8199 | 2.1398 |
| Fibonacci | 0.0469 | 0.3941 | 0.6086 | 0.9558 | 1.3030 | 1.5175 | 1.8647 |
Numerical data
The following are the details of the technical indicators and moving averages that were collected to generate this technical analysis:
| RSI (14): | 44.27 | |
| MACD (12,26,9): | -0.0048 | |
| Directional Movement: | -5.5047 | |
| AROON (14): | 35.7143 | |
| DEMA (21): | 0.6996 | |
| Parabolic SAR (0,02-0,02-0,2): | 0.6995 | |
| Elder Ray (13): | -0.0074 | |
| Super Trend (3,10): | 0.7329 | |
| Zig ZAG (10): | 0.6975 | |
| VORTEX (21): | 0.9560 | |
| Stochastique (14,3,5): | 36.87 | |
| TEMA (21): | 0.7061 | |
| Williams %R (14): | -70.00 | |
| Chande Momentum Oscillator (20): | 0.0050 | |
| Repulse (5,40,3): | -1.2440 | |
| ROCnROLL: | 2 | |
| TRIX (15,9): | -0.1549 | |
| Courbe Coppock: | 3.34 |
| MA7: | 0.7354 | |
| MA20: | 0.7935 | |
| MA50: | 1.1086 | |
| MA100: | 19.9899 | |
| MAexp7: | 0.7110 | |
| MAexp20: | 0.7091 | |
| MAexp50: | 0.7282 | |
| MAexp100: | 0.7574 | |
| Price / MA7: | -5.07% | |
| Price / MA20: | -12.02% | |
| Price / MA50: | -37.03% | |
| Price / MA100: | -96.51% | |
| Price / MAexp7: | -1.81% | |
| Price / MAexp20: | -1.55% | |
| Price / MAexp50: | -4.13% | |
| Price / MAexp100: | -7.83% |
News
Don"t forget to follow the news on WIRECARD AG. At the time of publication of this analysis, the latest news was as follows:
- DGAP-News: Opening of the insolvency proceedings of Wirecard AG
- DGAP-Adhoc: Wirecard AG: Termination employment contract Dr. Markus Braun
- DGAP-News: Wirecard AG informs customers and partners about current business operations
- DGAP-News: Wirecard AG: Company statement regarding filing for insolvency
- DGAP-Adhoc: Wirecard AG: Application for opening of insolvency proceedings
About author

Online


Add a comment
Comments
0 comments on the analysis WIRECARD AG - 1H