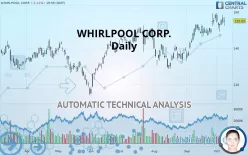
WHIRLPOOL CORP. - Daily - Technical analysis published on 10/09/2019 (GMT)
- 361
- 0
- Who voted?
Click here for a new analysis!
- Timeframe : Daily
- - Analysis generated on
- Status : TARGET REACHED

Summary of the analysis

Additional analysis
Quotes
The WHIRLPOOL CORP. rating is 155.05 USD. The price registered a decrease of -1.21% on the session and was traded between 152.26 USD and 157.02 USD over the period. The price is currently at +1.83% from its lowest and -1.25% from its highest.A bearish opening was detected by the Central Gaps scanner. Sellers are trying to impose a bearish trend in the very short term.
Bearish opening
Type : Bearish
Timeframe : Openning
A study of price movements over other periods shows the following variations:
Near a new HIGH record (1 year)
Type : Bullish
Timeframe : Weekly
Near a new HIGH record (1st january)
Type : Bullish
Timeframe : Weekly
Near a new HIGH record (1 month)
Type : Bullish
Timeframe : Weekly
Technical
Technical analysis of this Daily chart of WHIRLPOOL CORP. indicates that the overall trend is strongly bullish. 92.86% of the signals given by moving averages are bullish. The overall trend is supported by the strong bullish signals from short-term moving averages. The Central Indicators scanner does not detect any result on moving averages that would impact this trend.
Technical indicators are slightly bullish. There is therefore considerable uncertainty about the continuation of the increase.
Caution: the Central Indicators scanner currently detects an excess:
CCI indicator is overbought : over 100
Type : Neutral
Timeframe : Daily
MACD crosses UP its Moving Average
Type : Bullish
Timeframe : Daily
Price is back over the pivot point
Type : Bullish
Timeframe : Daily
Central Patterns, the scanner specializing in chart patterns, did not identify any signals.
Central Candlesticks, the scanner specialised in Japanese candlesticks, detects a bullish signal that could support the hypothesis of a small rebound in the very short term:
Three white soldiers
Type : Bullish
Timeframe : Daily
| S3 | S2 | S1 | Price | R1 | R2 | R3 | |
|---|---|---|---|---|---|---|---|
| ProTrendLines | 142.40 | 146.64 | 152.83 | 155.05 | 158.36 | 165.28 | 185.92 |
| Change (%) | -8.16% | -5.42% | -1.43% | - | +2.13% | +6.60% | +19.91% |
| Change | -12.65 | -8.41 | -2.22 | - | +3.31 | +10.23 | +30.87 |
| Level | Intermediate | Intermediate | Major | - | Major | Minor | Intermediate |
Attention could also be paid to pivot points to set price objectives:
| Pivot points | S3 | S2 | S1 | PP | R1 | R2 | R3 |
|---|---|---|---|---|---|---|---|
| Standard | 149.25 | 151.38 | 154.16 | 156.29 | 159.07 | 161.20 | 163.98 |
| Camarilla | 155.60 | 156.05 | 156.50 | 156.95 | 157.40 | 157.85 | 158.30 |
| Woodie | 149.59 | 151.54 | 154.50 | 156.45 | 159.41 | 161.36 | 164.32 |
| Fibonacci | 151.38 | 153.25 | 154.41 | 156.29 | 158.16 | 159.32 | 161.20 |
| Pivot points | S3 | S2 | S1 | PP | R1 | R2 | R3 |
|---|---|---|---|---|---|---|---|
| Standard | 139.69 | 144.42 | 149.88 | 154.61 | 160.07 | 164.80 | 170.26 |
| Camarilla | 152.53 | 153.46 | 154.40 | 155.33 | 156.26 | 157.20 | 158.13 |
| Woodie | 140.05 | 144.60 | 150.24 | 154.79 | 160.43 | 164.98 | 170.62 |
| Fibonacci | 144.42 | 148.32 | 150.72 | 154.61 | 158.51 | 160.91 | 164.80 |
| Pivot points | S3 | S2 | S1 | PP | R1 | R2 | R3 |
|---|---|---|---|---|---|---|---|
| Standard | 115.06 | 124.06 | 141.21 | 150.21 | 167.36 | 176.36 | 193.51 |
| Camarilla | 151.17 | 153.57 | 155.96 | 158.36 | 160.76 | 163.15 | 165.55 |
| Woodie | 119.14 | 126.10 | 145.29 | 152.25 | 171.44 | 178.40 | 197.59 |
| Fibonacci | 124.06 | 134.05 | 140.22 | 150.21 | 160.20 | 166.37 | 176.36 |
Numerical data
The following is the status of technical indicators and moving averages registered at the time this technical analysis was created:
| RSI (14): | 59.64 | |
| MACD (12,26,9): | 3.4300 | |
| Directional Movement: | 11.76 | |
| AROON (14): | 64.29 | |
| DEMA (21): | 156.24 | |
| Parabolic SAR (0,02-0,02-0,2): | 158.41 | |
| Elder Ray (13): | 1.21 | |
| Super Trend (3,10): | 145.05 | |
| Zig ZAG (10): | 155.05 | |
| VORTEX (21): | 1.0500 | |
| Stochastique (14,3,5): | 71.98 | |
| TEMA (21): | 157.24 | |
| Williams %R (14): | -34.65 | |
| Chande Momentum Oscillator (20): | 6.46 | |
| Repulse (5,40,3): | 2.9700 | |
| ROCnROLL: | 1 | |
| TRIX (15,9): | 0.3600 | |
| Courbe Coppock: | 7.12 |
| MA7: | 155.22 | |
| MA20: | 152.32 | |
| MA50: | 143.36 | |
| MA100: | 139.74 | |
| MAexp7: | 154.79 | |
| MAexp20: | 151.64 | |
| MAexp50: | 146.36 | |
| MAexp100: | 141.62 | |
| Price / MA7: | -0.11% | |
| Price / MA20: | +1.79% | |
| Price / MA50: | +8.15% | |
| Price / MA100: | +10.96% | |
| Price / MAexp7: | +0.17% | |
| Price / MAexp20: | +2.25% | |
| Price / MAexp50: | +5.94% | |
| Price / MAexp100: | +9.48% |
News
Don"t forget to follow the news on WHIRLPOOL CORP.. At the time of publication of this analysis, the latest news was as follows:
- Whirlpool Corporation recognized on Global CR RepTrak 100 ranking for seventh consecutive year
- Whirlpool Corporation and Indiana University Celebrate 10 years of Building Habitat for Humanity Homes with Monroe County, Indiana Families
- Whirlpool Corporation honored with fifth consecutive EPA SmartWay® Excellence Award, third consecutive High Performer recognition
- Whirlpool Corporation to Highlight People, Plants and Places During Manufacturing Month
- Whirlpool Corporation Named to 2019 Dow Jones Sustainability North America Index
About author

Online


Add a comment
Comments
0 comments on the analysis WHIRLPOOL CORP. - Daily