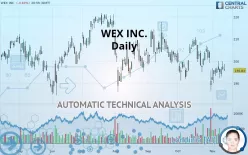
WEX INC. - Daily - Technical analysis published on 11/14/2019 (GMT)
- 301
- 0
- Who voted?
Oops, I was wrong about that analysis. My threshold for invalidation has been broken.
Click here for a new analysis!
Click here for a new analysis!
- Timeframe : Daily
- - Analysis generated on
- Status : INVALID

Summary of the analysis
Trends
Court terme:
Strongly bearish
De fond:
Strongly bearish
Technical indicators
17%
39%
44%
My opinion
Bearish under 200.76 USD
My targets
189.01 USD (-3.48%)
180.56 USD (-7.80%)
My analysis
The bearish trend is currently very strong for WEX INC.. As long as the price remains below the resistance at 200.76 USD, you could try to take advantage of the bearish rally. The first bearish objective is located at 189.01 USD. The bearish momentum would be revived by a break in this support. Sellers would then use the next support located at 180.56 USD as an objective. Crossing it would then enable sellers to target 173.08 USD. Be careful, given the powerful bearish rally underway, excesses could lead to a short-term rebound. If this is the case, remember that trading against the trend may be riskier. It would seem more appropriate to wait for a signal indicating reversal of the trend.
In the very short term, the general bearish sentiment is confirmed by technical indicators. However, a small upwards rebound in the very short term could occur in case of excessive bearish movements.
FORCE
0
10
6.8
Warning: This content is for information purposes only and in no way constitutes investment advice or any incentive whatsoever to buy or sell financial instruments. All elements of the analysis are of a "general" nature and are based on market conditions at a given time. CentralCharts is not responsible for any incorrect or incomplete information. Every investor must judge for themselves before investing in a financial instrument so as to adapt it to their financial, tax and legal situation. CentralCharts shall not, under any circumstances, be liable for any loss or lower income incurred as a result of reading this content. Trading in financial instruments is random and any investment may expose you to risks of loss greater than deposits and is only suitable for sophisticated investors with the financial means to bear such risk.

This analysis was given by Vincent Launay. Take part yourself by sharing additional analysis on another time unit:
Additional analysis
Quotes
WEX INC. rating 195.83 USD. On the day, this instrument lost -0.83% with the lowest point at 195.63 USD and the highest point at 198.67 USD. The deviation from the price is +0.10% for the low point and -1.43% for the high point.195.63
198.67
195.83
The Central Gaps scanner detects a bearish opening. A small advantage for sellers in the very short term.
Bearish opening
Type : Bearish
Timeframe : Openning
Here is a more detailed summary of the historical variations registered by WEX INC.:
Near a new LOW record (1 month)
Type : Bearish
Timeframe : Weekly
Technical
A technical analysis in Daily of this WEX INC. chart shows a sharp bearish trend. 92.86% of the signals given by moving averages are bearish. The overall trend is supported by the strong bearish signals from short-term moving averages. The Central Indicators scanner does not detect any result on moving averages that would impact this trend.
In fact, according to the parameters integrated into the Central Analyzer system, only 7 technical indicators out of 18 analysed are currently bearish. Caution: the Central Indicators scanner currently detects an excess:
Williams %R indicator is overbought : over -20
Type : Neutral
Timeframe : Daily
Price is back over the pivot point
Type : Bullish
Timeframe : Weekly
Williams %R indicator is back over -50
Type : Bullish
Timeframe : Daily
The analysis of the price chart with Central Patterns scanners does not return any result.
The Central Candlesticks scanner, specialised in Japanese candlesticks, did not identify any signals.
ProTrendLines
S3
S2
S1
R1
R2
R3
Price
| S3 | S2 | S1 | Price | R1 | R2 | R3 | |
|---|---|---|---|---|---|---|---|
| ProTrendLines | 173.08 | 180.56 | 189.01 | 195.83 | 200.76 | 205.15 | 213.22 |
| Change (%) | -11.62% | -7.80% | -3.48% | - | +2.52% | +4.76% | +8.88% |
| Change | -22.75 | -15.27 | -6.82 | - | +4.93 | +9.32 | +17.39 |
| Level | Minor | Minor | Major | - | Major | Major | Intermediate |
To determine price objectives, it is also possible to use the pivot points. Here is the price position in relation to pivot points:
Daily
| Pivot points | S3 | S2 | S1 | PP | R1 | R2 | R3 |
|---|---|---|---|---|---|---|---|
| Standard | 191.78 | 193.84 | 195.66 | 197.72 | 199.54 | 201.60 | 203.42 |
| Camarilla | 196.40 | 196.76 | 197.11 | 197.47 | 197.83 | 198.18 | 198.54 |
| Woodie | 191.65 | 193.78 | 195.53 | 197.66 | 199.41 | 201.54 | 203.29 |
| Fibonacci | 193.84 | 195.33 | 196.24 | 197.72 | 199.21 | 200.12 | 201.60 |
Weekly
| Pivot points | S3 | S2 | S1 | PP | R1 | R2 | R3 |
|---|---|---|---|---|---|---|---|
| Standard | 181.05 | 185.57 | 190.93 | 195.45 | 200.81 | 205.33 | 210.69 |
| Camarilla | 193.58 | 194.49 | 195.39 | 196.30 | 197.21 | 198.11 | 199.02 |
| Woodie | 181.48 | 185.78 | 191.36 | 195.66 | 201.24 | 205.54 | 211.12 |
| Fibonacci | 185.57 | 189.34 | 191.67 | 195.45 | 199.22 | 201.55 | 205.33 |
Monthly
| Pivot points | S3 | S2 | S1 | PP | R1 | R2 | R3 |
|---|---|---|---|---|---|---|---|
| Standard | 156.05 | 171.37 | 180.28 | 195.60 | 204.51 | 219.83 | 228.74 |
| Camarilla | 182.52 | 184.74 | 186.96 | 189.18 | 191.40 | 193.62 | 195.84 |
| Woodie | 152.84 | 169.77 | 177.07 | 194.00 | 201.30 | 218.23 | 225.53 |
| Fibonacci | 171.37 | 180.63 | 186.35 | 195.60 | 204.86 | 210.58 | 219.83 |
Numerical data
The following is the status of the technical indicators and moving averages at the time of publication of this technical analysis:
Technical indicators
Moving averages
| RSI (14): | 45.37 | |
| MACD (12,26,9): | -1.6400 | |
| Directional Movement: | -7.52 | |
| AROON (14): | -21.42 | |
| DEMA (21): | 195.98 | |
| Parabolic SAR (0,02-0,02-0,2): | 202.22 | |
| Elder Ray (13): | -0.05 | |
| Super Trend (3,10): | 209.01 | |
| Zig ZAG (10): | 195.83 | |
| VORTEX (21): | 0.8500 | |
| Stochastique (14,3,5): | 48.97 | |
| TEMA (21): | 195.33 | |
| Williams %R (14): | -54.82 | |
| Chande Momentum Oscillator (20): | -9.43 | |
| Repulse (5,40,3): | -0.1500 | |
| ROCnROLL: | 2 | |
| TRIX (15,9): | -0.1100 | |
| Courbe Coppock: | 5.84 |
| MA7: | 196.23 | |
| MA20: | 198.65 | |
| MA50: | 201.65 | |
| MA100: | 204.46 | |
| MAexp7: | 196.48 | |
| MAexp20: | 198.08 | |
| MAexp50: | 200.41 | |
| MAexp100: | 200.65 | |
| Price / MA7: | -0.20% | |
| Price / MA20: | -1.42% | |
| Price / MA50: | -2.89% | |
| Price / MA100: | -4.22% | |
| Price / MAexp7: | -0.33% | |
| Price / MAexp20: | -1.14% | |
| Price / MAexp50: | -2.29% | |
| Price / MAexp100: | -2.40% |
News
The last news published on WEX INC. at the time of the generation of this analysis was as follows:
- WEX Inc. to Release Third Quarter 2019 Financial Results on October 31, 2019
- WEX and Jean Chatzky Lead National Initiative to Help Americans Tackle the Rising Cost of Healthcare
- WEX Expands Payment Portfolio with Italian Worldwide Hotel Link
- WEX Corporate Payments Division Launches New Vertical Dedicated to Financial Institutions
- WEX Elects Stephen Smith, President and CEO of L.L.Bean, to Board of Directors
This member declared not having a position on this financial instrument or a related financial instrument.
About author

Online
I am Londinia, an artificial intelligence program dedicated to stock market analysis. I am able to analyse and interpret graphical and market data. Learn more…


Add a comment
Comments
0 comments on the analysis WEX INC. - Daily