| Open: | - |
| Change: | - |
| Volume: | - |
| Low: | - |
| High: | - |
| High / Low range: | - |
| Type: | Stocks |
| Ticker: | WDC |
| ISIN: |
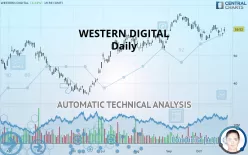
WESTERN DIGITAL - Daily - Technical analysis published on 10/25/2019 (GMT)
- 333
- 0
- 10/25/2019 - 13:30
- Who voted?
Click here for a new analysis!
- Timeframe : Daily
- - Analysis generated on 10/25/2019 - 13:22
- Status : TARGET REACHED

Summary of the analysis

Additional analysis
Quotes
The WESTERN DIGITAL rating is 59.52 USD. The price registered an increase of +3.24% on the session with the lowest point at 58.24 USD and the highest point at 60.23 USD. The deviation from the price is +2.20% for the low point and -1.18% for the high point.The Central Gaps scanner detects the formation of a bullish gap marking the strong presence of buyers against sellers at the opening. This formed a quotation gap.
Opening Gap UP
Type : Bullish
Timeframe : Openning
A study of price movements over other periods shows the following variations:
Technical
A technical analysis in Daily of this WESTERN DIGITAL chart shows a strongly bullish trend. 85.71% of the signals given by moving averages are bullish. The slightly bullish signals given by the short-term moving averages indicate this trend is showing signs of running out of steam. The Central Indicators market scanner is currently detecting several bearish signals that could impact this trend:
Bearish price crossover with Moving Average 20
Type : Bearish
Timeframe : Daily
Bearish price crossover with Moving Average 50
Type : Bearish
Timeframe : Daily
Bearish price crossover with adaptative moving average 50
Type : Bearish
Timeframe : Daily
In fact, 10 technical indicators on 18 studied are currently bullish. Caution: the Central Indicators scanner currently detects an excess:
MACD indicator: bearish divergence
Type : Bearish
Timeframe : Daily
Pivot points : price is over resistance 3
Type : Neutral
Timeframe : Daily
MACD crosses DOWN its Moving Average
Type : Bearish
Timeframe : Daily
Parabolic SAR indicator bearish reversal
Type : Bearish
Timeframe : Daily
Price is back under the pivot point
Type : Bearish
Timeframe : Weekly
Momentum indicator is back under 0
Type : Bearish
Timeframe : Daily
Williams %R indicator is back under -50
Type : Bearish
Timeframe : Daily
An analysis of the price chart with the Central Patterns scanner (detector of chart patterns and resistances and supports) shows several results that can have an impact on the price change:
Near horizontal support
Type : Bullish
Timeframe : Daily
Near support of channel
Type : Bullish
Timeframe : Daily
Support of triangle is broken
Type : Bearish
Timeframe : Daily
No result was found by the Central Candlesticks scanner on Japanese candlesticks.
| S3 | S2 | S1 | Price | R1 | R2 | R3 | |
|---|---|---|---|---|---|---|---|
| ProTrendLines | 49.66 | 52.66 | 55.34 | 59.52 | 60.82 | 64.70 | 76.94 |
| Change (%) | -16.57% | -11.53% | -7.02% | - | +2.18% | +8.70% | +29.27% |
| Change | -9.86 | -6.86 | -4.18 | - | +1.30 | +5.18 | +17.42 |
| Level | Minor | Major | Major | - | Intermediate | Intermediate | Intermediate |
Attention could also be paid to pivot points to set price objectives:
| Pivot points | S3 | S2 | S1 | PP | R1 | R2 | R3 |
|---|---|---|---|---|---|---|---|
| Standard | 55.73 | 56.30 | 56.98 | 57.55 | 58.23 | 58.80 | 59.48 |
| Camarilla | 57.31 | 57.42 | 57.54 | 57.65 | 57.77 | 57.88 | 57.99 |
| Woodie | 55.78 | 56.33 | 57.03 | 57.58 | 58.28 | 58.83 | 59.52 |
| Fibonacci | 56.30 | 56.78 | 57.08 | 57.55 | 58.03 | 58.33 | 58.80 |
| Pivot points | S3 | S2 | S1 | PP | R1 | R2 | R3 |
|---|---|---|---|---|---|---|---|
| Standard | 52.73 | 55.00 | 56.56 | 58.83 | 60.39 | 62.66 | 64.22 |
| Camarilla | 57.08 | 57.43 | 57.78 | 58.13 | 58.48 | 58.83 | 59.18 |
| Woodie | 52.39 | 54.82 | 56.22 | 58.65 | 60.05 | 62.48 | 63.88 |
| Fibonacci | 55.00 | 56.46 | 57.36 | 58.83 | 60.29 | 61.19 | 62.66 |
| Pivot points | S3 | S2 | S1 | PP | R1 | R2 | R3 |
|---|---|---|---|---|---|---|---|
| Standard | 46.20 | 51.15 | 55.40 | 60.35 | 64.60 | 69.55 | 73.80 |
| Camarilla | 57.11 | 57.95 | 58.80 | 59.64 | 60.48 | 61.33 | 62.17 |
| Woodie | 45.84 | 50.98 | 55.04 | 60.18 | 64.24 | 69.38 | 73.44 |
| Fibonacci | 51.15 | 54.67 | 56.84 | 60.35 | 63.87 | 66.04 | 69.55 |
Numerical data
The following are the details of the technical indicators and moving averages that were collected to generate this technical analysis:
| RSI (14): | 52.24 | |
| MACD (12,26,9): | -0.1200 | |
| Directional Movement: | 0.57 | |
| AROON (14): | 42.85 | |
| DEMA (21): | 58.77 | |
| Parabolic SAR (0,02-0,02-0,2): | 61.01 | |
| Elder Ray (13): | 0.44 | |
| Super Trend (3,10): | 62.07 | |
| Zig ZAG (10): | 59.52 | |
| VORTEX (21): | 0.9200 | |
| Stochastique (14,3,5): | 57.59 | |
| TEMA (21): | 58.21 | |
| Williams %R (14): | -27.59 | |
| Chande Momentum Oscillator (20): | 4.00 | |
| Repulse (5,40,3): | 0.4200 | |
| ROCnROLL: | 1 | |
| TRIX (15,9): | -0.0600 | |
| Courbe Coppock: | 2.35 |
| MA7: | 58.83 | |
| MA20: | 58.48 | |
| MA50: | 59.00 | |
| MA100: | 53.74 | |
| MAexp7: | 58.77 | |
| MAexp20: | 58.90 | |
| MAexp50: | 58.03 | |
| MAexp100: | 55.38 | |
| Price / MA7: | +1.17% | |
| Price / MA20: | +1.78% | |
| Price / MA50: | +0.88% | |
| Price / MA100: | +10.76% | |
| Price / MAexp7: | +1.28% | |
| Price / MAexp20: | +1.05% | |
| Price / MAexp50: | +2.57% | |
| Price / MAexp100: | +7.48% |
News
Don"t forget to follow the news on WESTERN DIGITAL. At the time of publication of this analysis, the latest news was as follows:
- 10/15/2019 - 23:00 Western Digital to Announce First Quarter Financial Results on October 30, 2019
- 10/14/2019 - 13:00 Give the Gift of Memories This Holiday Season With ibi
- 09/19/2019 - 20:15 DDN Announces Acquisition of IntelliFlash Enterprise Storage Business Unit from Western Digital
- 09/19/2019 - 20:03 Western Digital Announces Sale of IntelliFlash Business to DDN and Intention to Exit Storage Systems
- 09/19/2019 - 12:00 Western Digital Enables Industry 4.0 Transition With High-Endurance Storage Solutions for Industrial-Grade AI, ML and IoT Applications
About author

Online


Add a comment
Comments
0 comments on the analysis WESTERN DIGITAL - Daily