WEST BANCORP. - Daily - Technical analysis published on 09/13/2019 (GMT)
- 183
- 0
- Who voted?
Click here for a new analysis!
- Timeframe : Daily
- - Analysis generated on
- Status : TARGET REACHED
Summary of the analysis

Additional analysis
Quotes
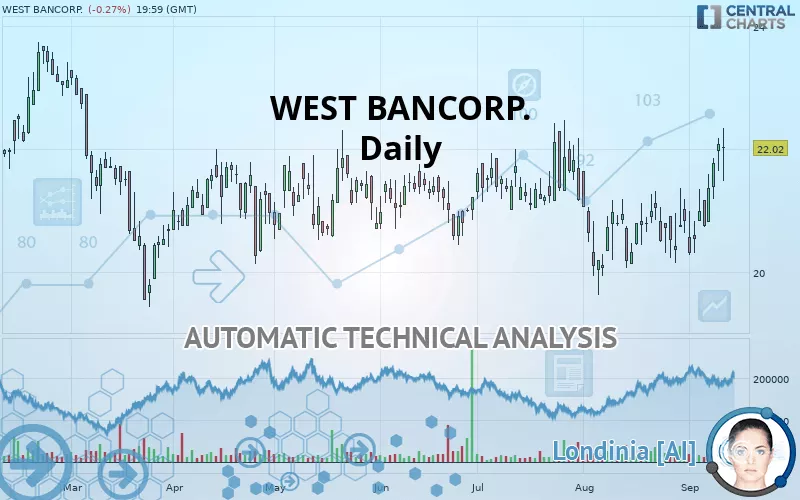
The WEST BANCORP. price is 22.02 USD. The price is lower by -0.27% since the last closing and was traded between 21.48 USD and 22.35 USD over the period. The price is currently at +2.51% from its lowest and -1.48% from its highest.The Central Gaps scanner detects a bearish opening. A small advantage for sellers in the very short term.
Bearish opening
Type : Bearish
Timeframe : Openning
So that you have an overall view of the price change, here is a table showing the variations over several periods:
Technical
Technical analysis of this Daily chart of WEST BANCORP. indicates that the overall trend is bullish. 75% of the signals given by moving averages are bullish. The overall trend is reinforced by the strong bullish signals from short-term moving averages. The Central Indicators market scanner currently does not detect any result that concerns moving averages.
In fact, according to the parameters integrated into the Central Analyzer system, 16 technical indicators out of 18 analysed are currently bullish. Caution: the Central Indicators scanner currently detects an excess:
CCI indicator is overbought : over 100
Type : Neutral
Timeframe : Daily
Previous candle closed over Bollinger bands
Type : Neutral
Timeframe : Daily
Williams %R indicator is overbought : over -20
Type : Neutral
Timeframe : Daily
Pivot points : price is over resistance 2
Type : Neutral
Timeframe : Weekly
SuperTrend indicator bullish reversal
Type : Bullish
Timeframe : Daily
Price is back over the pivot point
Type : Bullish
Timeframe : Daily
Central Patterns, the market scanner focusing on chart patterns, resistances and supports found these results:
Near resistance of triangle
Type : Bearish
Timeframe : Daily
Resistance of channel is broken
Type : Bullish
Timeframe : Daily
The Central Candlesticks scanner, specialised in Japanese candlesticks, did not identify any signals.
| S3 | S2 | S1 | Price | R1 | R2 | R3 | |
|---|---|---|---|---|---|---|---|
| ProTrendLines | 19.56 | 20.90 | 21.72 | 22.02 | 22.11 | 23.16 | 23.60 |
| Change (%) | -11.17% | -5.09% | -1.36% | - | +0.41% | +5.18% | +7.18% |
| Change | -2.46 | -1.12 | -0.30 | - | +0.09 | +1.14 | +1.58 |
| Level | Intermediate | Major | Minor | - | Intermediate | Minor | Intermediate |
To determine price objectives, it is also possible to use the pivot points. Here is the price position in relation to pivot points:
| Pivot points | S3 | S2 | S1 | PP | R1 | R2 | R3 |
|---|---|---|---|---|---|---|---|
| Standard | 21.22 | 21.43 | 21.76 | 21.97 | 22.30 | 22.51 | 22.84 |
| Camarilla | 21.93 | 21.98 | 22.03 | 22.08 | 22.13 | 22.18 | 22.23 |
| Woodie | 21.27 | 21.46 | 21.81 | 22.00 | 22.35 | 22.54 | 22.89 |
| Fibonacci | 21.43 | 21.64 | 21.77 | 21.97 | 22.18 | 22.31 | 22.51 |
| Pivot points | S3 | S2 | S1 | PP | R1 | R2 | R3 |
|---|---|---|---|---|---|---|---|
| Standard | 19.15 | 19.72 | 20.23 | 20.80 | 21.31 | 21.88 | 22.39 |
| Camarilla | 20.45 | 20.55 | 20.65 | 20.75 | 20.85 | 20.95 | 21.05 |
| Woodie | 19.13 | 19.71 | 20.21 | 20.79 | 21.29 | 21.87 | 22.37 |
| Fibonacci | 19.72 | 20.13 | 20.38 | 20.80 | 21.21 | 21.46 | 21.88 |
| Pivot points | S3 | S2 | S1 | PP | R1 | R2 | R3 |
|---|---|---|---|---|---|---|---|
| Standard | 17.74 | 18.69 | 19.76 | 20.71 | 21.78 | 22.73 | 23.80 |
| Camarilla | 20.29 | 20.47 | 20.66 | 20.84 | 21.03 | 21.21 | 21.40 |
| Woodie | 17.81 | 18.72 | 19.83 | 20.74 | 21.85 | 22.76 | 23.87 |
| Fibonacci | 18.69 | 19.46 | 19.94 | 20.71 | 21.48 | 21.96 | 22.73 |
Numerical data
The following are the details of the technical indicators and moving averages that were collected to generate this technical analysis:
| RSI (14): | 62.91 | |
| MACD (12,26,9): | 0.2100 | |
| Directional Movement: | 10.89 | |
| AROON (14): | 71.43 | |
| DEMA (21): | 21.28 | |
| Parabolic SAR (0,02-0,02-0,2): | 20.56 | |
| Elder Ray (13): | 0.69 | |
| Super Trend (3,10): | 20.04 | |
| Zig ZAG (10): | 22.02 | |
| VORTEX (21): | 0.9800 | |
| Stochastique (14,3,5): | 91.63 | |
| TEMA (21): | 21.56 | |
| Williams %R (14): | -15.01 | |
| Chande Momentum Oscillator (20): | 1.30 | |
| Repulse (5,40,3): | 2.5800 | |
| ROCnROLL: | 1 | |
| TRIX (15,9): | 0.0100 | |
| Courbe Coppock: | 6.35 |
| MA7: | 21.36 | |
| MA20: | 20.92 | |
| MA50: | 21.07 | |
| MA100: | 21.14 | |
| MAexp7: | 21.51 | |
| MAexp20: | 21.10 | |
| MAexp50: | 21.04 | |
| MAexp100: | 21.13 | |
| Price / MA7: | +3.09% | |
| Price / MA20: | +5.26% | |
| Price / MA50: | +4.51% | |
| Price / MA100: | +4.16% | |
| Price / MAexp7: | +2.37% | |
| Price / MAexp20: | +4.36% | |
| Price / MAexp50: | +4.66% | |
| Price / MAexp100: | +4.21% |
News
The last news published on WEST BANCORP. at the time of the generation of this analysis was as follows:
- East West Bancorp Announces Date for First Quarter 2019 Financial Results
- East West Bancorp Completes Successful SS&C Implementation for CECL Transition
- Investor Network: East West Bancorp, Inc. to Host Earnings Call
- Investor Network: West Bancorporation, Inc. to Host Earnings Call
-
 West Bancorp
About author

Online


Add a comment
Comments
0 comments on the analysis WEST BANCORP. - Daily