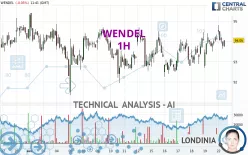
WENDEL - 1H - Technical analysis published on 04/22/2024 (GMT)
- 213
- 0
Click here for a new analysis!
- Timeframe : 1H
- - Analysis generated on
- Status : TARGET REACHED

Summary of the analysis

Additional analysis
Quotes
The WENDEL rating is 93.95 EUR. The price is lower by -0.16% since the last closing and was traded between 93.65 EUR and 94.80 EUR over the period. The price is currently at +0.32% from its lowest and -0.90% from its highest.A bullish gap was detected at the opening by the Central Gaps scanner. There are a lot of buyers and they have the upper hand in the very short term.
Opening Gap UP
Type : Bullish
Timeframe : Openning
So that you have an overall view of the price change, here is a table showing the variations over several periods:
Near a new HIGH record (1st january)
Type : Bullish
Timeframe : Weekly
Near a new LOW record (1 month)
Type : Bearish
Timeframe : Weekly
Technical
Technical analysis of this 1H chart of WENDEL indicates that the overall trend is strongly bullish. 89.29% of the signals given by moving averages are bullish. The overall trend is supported by the strong bullish signals from short-term moving averages. The Central Indicators scanner detects bullish signals on moving averages that could impact this trend:
Bullish price crossover with Moving Average 20
Type : Bullish
Timeframe : 1 hour
Bullish price crossover with adaptative moving average 100
Type : Bullish
Timeframe : 1 hour
In fact, only 7 technical indicators out of 18 studied are currently bullish. Central Indicators, the scanner specialised in technical indicators, has identified this signal:
RSI indicator is back over 50
Type : Bullish
Timeframe : 1 hour
Central Patterns, the market scanner focusing on chart patterns, resistances and supports found these results:
Near resistance of channel
Type : Bearish
Timeframe : 1 hour
Near resistance of triangle
Type : Bearish
Timeframe : 1 hour
No result was found by the Central Candlesticks scanner on Japanese candlesticks.
| S3 | S2 | S1 | Price | R1 | R2 | R3 | |
|---|---|---|---|---|---|---|---|
| ProTrendLines | 91.35 | 92.58 | 93.50 | 93.95 | 94.54 | 95.40 | 99.30 |
| Change (%) | -2.77% | -1.46% | -0.48% | - | +0.63% | +1.54% | +5.69% |
| Change | -2.60 | -1.37 | -0.45 | - | +0.59 | +1.45 | +5.35 |
| Level | Intermediate | Intermediate | Intermediate | - | Major | Minor | Intermediate |
Pivot points can also be used to set your price objectives. Here is the price situation in relation to pivot points:
| Pivot points | S3 | S2 | S1 | PP | R1 | R2 | R3 |
|---|---|---|---|---|---|---|---|
| Standard | 91.37 | 92.03 | 93.07 | 93.73 | 94.77 | 95.43 | 96.47 |
| Camarilla | 93.63 | 93.79 | 93.94 | 94.10 | 94.26 | 94.41 | 94.57 |
| Woodie | 91.55 | 92.13 | 93.25 | 93.83 | 94.95 | 95.53 | 96.65 |
| Fibonacci | 92.03 | 92.68 | 93.08 | 93.73 | 94.38 | 94.78 | 95.43 |
| Pivot points | S3 | S2 | S1 | PP | R1 | R2 | R3 |
|---|---|---|---|---|---|---|---|
| Standard | 90.48 | 91.37 | 92.73 | 93.62 | 94.98 | 95.87 | 97.23 |
| Camarilla | 93.48 | 93.69 | 93.89 | 94.10 | 94.31 | 94.51 | 94.72 |
| Woodie | 90.73 | 91.49 | 92.98 | 93.74 | 95.23 | 95.99 | 97.48 |
| Fibonacci | 91.37 | 92.23 | 92.76 | 93.62 | 94.48 | 95.01 | 95.87 |
| Pivot points | S3 | S2 | S1 | PP | R1 | R2 | R3 |
|---|---|---|---|---|---|---|---|
| Standard | 83.53 | 85.97 | 90.28 | 92.72 | 97.03 | 99.47 | 103.78 |
| Camarilla | 92.74 | 93.36 | 93.98 | 94.60 | 95.22 | 95.84 | 96.46 |
| Woodie | 84.48 | 86.44 | 91.23 | 93.19 | 97.98 | 99.94 | 104.73 |
| Fibonacci | 85.97 | 88.55 | 90.14 | 92.72 | 95.30 | 96.89 | 99.47 |
Numerical data
The following is the status of the technical indicators and moving averages at the time of publication of this technical analysis:
| RSI (14): | 52.05 | |
| MACD (12,26,9): | 0.1500 | |
| Directional Movement: | -1.17 | |
| AROON (14): | 64.29 | |
| DEMA (21): | 94.10 | |
| Parabolic SAR (0,02-0,02-0,2): | 93.04 | |
| Elder Ray (13): | -0.10 | |
| Super Trend (3,10): | 93.18 | |
| Zig ZAG (10): | 93.95 | |
| VORTEX (21): | 1.0700 | |
| Stochastique (14,3,5): | 58.73 | |
| TEMA (21): | 94.15 | |
| Williams %R (14): | -40.48 | |
| Chande Momentum Oscillator (20): | 0.05 | |
| Repulse (5,40,3): | -0.1100 | |
| ROCnROLL: | -1 | |
| TRIX (15,9): | 0.0300 | |
| Courbe Coppock: | 0.66 |
| MA7: | 93.44 | |
| MA20: | 93.58 | |
| MA50: | 91.36 | |
| MA100: | 86.19 | |
| MAexp7: | 94.00 | |
| MAexp20: | 93.89 | |
| MAexp50: | 93.68 | |
| MAexp100: | 93.56 | |
| Price / MA7: | +0.55% | |
| Price / MA20: | +0.40% | |
| Price / MA50: | +2.83% | |
| Price / MA100: | +9.00% | |
| Price / MAexp7: | -0.05% | |
| Price / MAexp20: | +0.06% | |
| Price / MAexp50: | +0.29% | |
| Price / MAexp100: | +0.42% |
News
Don't forget to follow the news on WENDEL. At the time of publication of this analysis, the latest news was as follows:
- WENDEL: Wendel launches the sale of approximately 9% of Bureau Veritas’ share capital
- WENDEL: Shareholders’ Meeting set for May 16, 2024
- Wendel: Availability of the 2023 Universal Registration Document
- WENDEL: 2023 Full-Year Results
- Wendel Press Release
About author
Online


Add a comment
Comments
0 comments on the analysis WENDEL - 1H