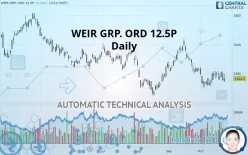
WEIR GRP. ORD 12.5P - Daily - Technical analysis published on 10/23/2019 (GMT)
- 325
- 0
- Who voted?
Click here for a new analysis!
- Timeframe : Daily
- - Analysis generated on
- Status : INVALID

Summary of the analysis

Additional analysis
Quotes
The WEIR GRP. ORD 12.5P price is 1,364.5 GBX. The price registered an increase of +1.04% on the session and was traded between 1,339.0 GBX and 1,397.0 GBX over the period. The price is currently at +1.90% from its lowest and -2.33% from its highest.A bearish gap was detected at the opening by the Central Gaps scanner. There are a lot of sellers and they have the upper hand in the very short term.
Opening Gap DOWN
Type : Bearish
Timeframe : Openning
Here is a more detailed summary of the historical variations registered by WEIR GRP. ORD 12.5P:
Near a new LOW record (1 month)
Type : Bearish
Timeframe : Weekly
Technical
Technical analysis of WEIR GRP. ORD 12.5P in Daily shows an overall bearish trend. 78.57% of the signals given by moving averages are bearish. The overall trend seems to be showing some signs of weakness, as do the tentative bearish signals from short-term moving averages. The Central Indicators scanner detects bearish signals on moving averages that could impact this trend:
Bearish price crossover with Moving Average 20
Type : Bearish
Timeframe : Daily
Bearish price crossover with Moving Average 50
Type : Bearish
Timeframe : Daily
Bearish price crossover with adaptative moving average 20
Type : Bearish
Timeframe : Daily
An assessment of technical indicators shows a slightly bullish signal.
Central Indicators, the scanner specialised in technical indicators, has identified these signals:
RSI indicator is back under 50
Type : Bearish
Timeframe : Daily
Ichimoku : price is under the cloud
Type : Bearish
Timeframe : Daily
Price is back under the pivot point
Type : Bearish
Timeframe : Daily
Price is back under the pivot point
Type : Bearish
Timeframe : Weekly
Central Patterns, the market scanner focusing on chart patterns, resistances and supports found this result:
Near horizontal resistance
Type : Bearish
Timeframe : Daily
No result was found by the Central Candlesticks scanner on Japanese candlesticks.
| S3 | S2 | S1 | Price | R1 | R2 | R3 | |
|---|---|---|---|---|---|---|---|
| ProTrendLines | 992.0 | 1,246.4 | 1,320.0 | 1,364.5 | 1,382.3 | 1,573.1 | 1,650.0 |
| Change (%) | -27.30% | -8.66% | -3.26% | - | +1.30% | +15.29% | +20.92% |
| Change | -372.5 | -118.1 | -44.5 | - | +17.8 | +208.6 | +285.5 |
| Level | Minor | Major | Major | - | Major | Intermediate | Minor |
Pivot points can also be used to set your price objectives. Here is the price situation in relation to pivot points:
| Pivot points | S3 | S2 | S1 | PP | R1 | R2 | R3 |
|---|---|---|---|---|---|---|---|
| Standard | 1,263.8 | 1,307.2 | 1,328.8 | 1,372.2 | 1,393.8 | 1,437.2 | 1,458.8 |
| Camarilla | 1,332.6 | 1,338.6 | 1,344.5 | 1,350.5 | 1,356.5 | 1,362.4 | 1,368.4 |
| Woodie | 1,253.0 | 1,301.8 | 1,318.0 | 1,366.8 | 1,383.0 | 1,431.8 | 1,448.0 |
| Fibonacci | 1,307.2 | 1,332.0 | 1,347.3 | 1,372.2 | 1,397.0 | 1,412.3 | 1,437.2 |
| Pivot points | S3 | S2 | S1 | PP | R1 | R2 | R3 |
|---|---|---|---|---|---|---|---|
| Standard | 1,273.8 | 1,312.7 | 1,338.3 | 1,377.2 | 1,402.8 | 1,441.7 | 1,467.3 |
| Camarilla | 1,346.3 | 1,352.2 | 1,358.1 | 1,364.0 | 1,369.9 | 1,375.8 | 1,381.7 |
| Woodie | 1,267.3 | 1,309.4 | 1,331.8 | 1,373.9 | 1,396.3 | 1,438.4 | 1,460.8 |
| Fibonacci | 1,312.7 | 1,337.3 | 1,352.5 | 1,377.2 | 1,401.8 | 1,417.0 | 1,441.7 |
| Pivot points | S3 | S2 | S1 | PP | R1 | R2 | R3 |
|---|---|---|---|---|---|---|---|
| Standard | 1,086.4 | 1,234.0 | 1,320.9 | 1,468.6 | 1,555.5 | 1,703.2 | 1,790.1 |
| Camarilla | 1,343.3 | 1,364.9 | 1,386.4 | 1,407.9 | 1,429.4 | 1,450.9 | 1,472.4 |
| Woodie | 1,056.0 | 1,218.8 | 1,290.6 | 1,453.4 | 1,525.1 | 1,688.0 | 1,759.7 |
| Fibonacci | 1,234.0 | 1,323.6 | 1,379.0 | 1,468.6 | 1,558.2 | 1,613.5 | 1,703.2 |
Numerical data
The following are the details of the technical indicators and moving averages that were collected to generate this technical analysis:
| RSI (14): | 46.70 | |
| MACD (12,26,9): | -12.4000 | |
| Directional Movement: | -3.2 | |
| AROON (14): | 57.1 | |
| DEMA (21): | 1,361.3 | |
| Parabolic SAR (0,02-0,02-0,2): | 1,330.3 | |
| Elder Ray (13): | -4.9 | |
| Super Trend (3,10): | 1,433.4 | |
| Zig ZAG (10): | 1,365.0 | |
| VORTEX (21): | 0.9000 | |
| Stochastique (14,3,5): | 67.50 | |
| TEMA (21): | 1,357.9 | |
| Williams %R (14): | -40.30 | |
| Chande Momentum Oscillator (20): | 35.2 | |
| Repulse (5,40,3): | -2.2000 | |
| ROCnROLL: | 2 | |
| TRIX (15,9): | -0.2000 | |
| Courbe Coppock: | 3.30 |
| MA7: | 1,378.1 | |
| MA20: | 1,363.0 | |
| MA50: | 1,398.3 | |
| MA100: | 1,430.4 | |
| MAexp7: | 1,371.3 | |
| MAexp20: | 1,378.9 | |
| MAexp50: | 1,401.4 | |
| MAexp100: | 1,428.7 | |
| Price / MA7: | -0.99% | |
| Price / MA20: | +0.11% | |
| Price / MA50: | -2.42% | |
| Price / MA100: | -4.61% | |
| Price / MAexp7: | -0.50% | |
| Price / MAexp20: | -1.04% | |
| Price / MAexp50: | -2.63% | |
| Price / MAexp100: | -4.49% |
News
The latest news and videos published on WEIR GRP. ORD 12.5P at the time of the analysis were as follows:
- Weir Oil & Gas Introduces Industry’s First Continuous Duty 5000-Horsepower Pump Specifically Designed for Electric or Gas Turbine-Driven Applications
- Weir’s New SPM® EXL Frac Pump Has Highest Rod Load Rating in Its Class
- Global Weir Edge™ Services Offerings Expanded, Reducing Downtime and Total Cost of Ownership
- Weir Introduces Enhanced, Field-Proven Unitized™ Lock-Ring (ULR) Wellhead
- Weir Oil & Gas Introduces SPM® SafeEdge™ ARC for Remote Setting and Digital Control of Relief Valves
About author

Online


Add a comment
Comments
0 comments on the analysis WEIR GRP. ORD 12.5P - Daily