| Open: | - |
| Change: | - |
| Volume: | - |
| Low: | - |
| High: | - |
| High / Low range: | - |
| Type: | Stocks |
| Ticker: | WBS |
| ISIN: |
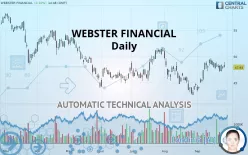
WEBSTER FINANCIAL - Daily - Technical analysis published on 09/27/2019 (GMT)
- 195
- 0
- 09/27/2019 - 15:06
- Who voted?
Click here for a new analysis!
- Timeframe : Daily
- - Analysis generated on 09/27/2019 - 15:04
- Status : INVALID

Summary of the analysis

Additional analysis
Quotes
The WEBSTER FINANCIAL rating is 47.93 USD. On the day, this instrument gained +0.10% and was traded between 47.91 USD and 48.96 USD over the period. The price is currently at +0.04% from its lowest and -2.10% from its highest.The Central Gaps scanner detects the formation of a bullish gap marking the strong presence of buyers against sellers at the opening. This formed a quotation gap.
Opening Gap UP
Type : Bullish
Timeframe : Openning
Here is a more detailed summary of the historical variations registered by WEBSTER FINANCIAL:
Near a new HIGH record (1 month)
Type : Bullish
Timeframe : Weekly
Technical
Technical analysis of this Daily chart of WEBSTER FINANCIAL indicates that the overall trend is bullish. 64.29% of the signals given by moving averages are bullish. This bullish trend is supported by the strong bullish signals given by short-term moving averages. An assessment of moving averages reveals a bearish signal that could impact this trend:
Bearish price crossover with adaptative moving average 50
Type : Bearish
Timeframe : Daily
An assessment of technical indicators does not currently provide any relevant information on the direction of future price movements.
Other results related to technical indicators were also found by the Central Indicators scanner:
Pivot points : price is over resistance 1
Type : Neutral
Timeframe : Daily
Momentum indicator is back under 0
Type : Bearish
Timeframe : Daily
Central Patterns, the market scanner focusing on chart patterns, resistances and supports found this result:
Near horizontal resistance
Type : Bearish
Timeframe : Daily
Central Candlesticks, the scanner specialised in Japanese candlesticks, detects a bearish signal that could support the hypothesis of a small drop in the very short term:
Bearish harami
Type : Bearish
Timeframe : Daily
| S3 | S2 | S1 | Price | R1 | R2 | R3 | |
|---|---|---|---|---|---|---|---|
| ProTrendLines | 43.00 | 44.73 | 45.90 | 47.93 | 48.83 | 51.31 | 53.88 |
| Change (%) | -10.29% | -6.68% | -4.24% | - | +1.88% | +7.05% | +12.41% |
| Change | -4.93 | -3.20 | -2.03 | - | +0.90 | +3.38 | +5.95 |
| Level | Major | Major | Intermediate | - | Major | Major | Minor |
To determine price objectives, it is also possible to use the pivot points. Here is the price position in relation to pivot points:
| Pivot points | S3 | S2 | S1 | PP | R1 | R2 | R3 |
|---|---|---|---|---|---|---|---|
| Standard | 47.02 | 47.29 | 47.58 | 47.85 | 48.14 | 48.41 | 48.70 |
| Camarilla | 47.73 | 47.78 | 47.83 | 47.88 | 47.93 | 47.98 | 48.03 |
| Woodie | 47.04 | 47.30 | 47.60 | 47.86 | 48.16 | 48.42 | 48.72 |
| Fibonacci | 47.29 | 47.50 | 47.63 | 47.85 | 48.06 | 48.19 | 48.41 |
| Pivot points | S3 | S2 | S1 | PP | R1 | R2 | R3 |
|---|---|---|---|---|---|---|---|
| Standard | 45.51 | 46.60 | 47.49 | 48.58 | 49.47 | 50.56 | 51.45 |
| Camarilla | 47.84 | 48.02 | 48.20 | 48.38 | 48.56 | 48.74 | 48.92 |
| Woodie | 45.41 | 46.55 | 47.39 | 48.53 | 49.37 | 50.51 | 51.35 |
| Fibonacci | 46.60 | 47.36 | 47.82 | 48.58 | 49.34 | 49.80 | 50.56 |
| Pivot points | S3 | S2 | S1 | PP | R1 | R2 | R3 |
|---|---|---|---|---|---|---|---|
| Standard | 32.61 | 37.62 | 41.19 | 46.19 | 49.76 | 54.77 | 58.34 |
| Camarilla | 42.40 | 43.19 | 43.97 | 44.76 | 45.55 | 46.33 | 47.12 |
| Woodie | 31.90 | 37.26 | 40.47 | 45.83 | 49.05 | 54.41 | 57.62 |
| Fibonacci | 37.62 | 40.89 | 42.92 | 46.19 | 49.47 | 51.49 | 54.77 |
Numerical data
The following is the status of the technical indicators and moving averages at the time of publication of this technical analysis:
| RSI (14): | 54.47 | |
| MACD (12,26,9): | 0.5000 | |
| Directional Movement: | 7.25 | |
| AROON (14): | 35.71 | |
| DEMA (21): | 48.18 | |
| Parabolic SAR (0,02-0,02-0,2): | 49.52 | |
| Elder Ray (13): | 0.64 | |
| Super Trend (3,10): | 45.22 | |
| Zig ZAG (10): | 48.25 | |
| VORTEX (21): | 1.1100 | |
| Stochastique (14,3,5): | 57.19 | |
| TEMA (21): | 48.63 | |
| Williams %R (14): | -56.92 | |
| Chande Momentum Oscillator (20): | -0.18 | |
| Repulse (5,40,3): | -0.5800 | |
| ROCnROLL: | 1 | |
| TRIX (15,9): | 0.1500 | |
| Courbe Coppock: | 9.56 |
| MA7: | 47.98 | |
| MA20: | 47.39 | |
| MA50: | 47.33 | |
| MA100: | 47.13 | |
| MAexp7: | 48.04 | |
| MAexp20: | 47.56 | |
| MAexp50: | 47.24 | |
| MAexp100: | 47.93 | |
| Price / MA7: | -0.10% | |
| Price / MA20: | +1.14% | |
| Price / MA50: | +1.27% | |
| Price / MA100: | +1.70% | |
| Price / MAexp7: | -0.23% | |
| Price / MAexp20: | +0.78% | |
| Price / MAexp50: | +1.46% | |
| Price / MAexp100: | -0% |
News
The last news published on WEBSTER FINANCIAL at the time of the generation of this analysis was as follows:
- 11/16/2017 - 18:12 Two Webster Board Members Honored
- 10/24/2017 - 20:15 Webster Financial Corporation Declares Common Dividend
- 10/19/2017 - 11:30 Webster Reports Record Third Quarter 2017 Earnings
- 10/17/2017 - 20:45 Webster Financial Corporation Releases Results of 2017 Dodd-Frank Act Stress Test
- 10/06/2017 - 19:48 Webster Financial Corporation Announces Third Quarter 2017 Earnings Release and Conference Call
About author

Online


Add a comment
Comments
0 comments on the analysis WEBSTER FINANCIAL - Daily