WASTE MANAGEMENT INC. - 1H - Technical analysis published on 02/20/2025 (GMT)
- 87
- 0
Click here for a new analysis!
- Timeframe : 1H
- - Analysis generated on
- Status : TARGET REACHED

Summary of the analysis

Additional analysis
Quotes
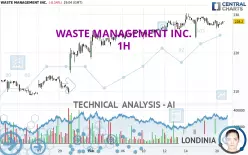
The WASTE MANAGEMENT INC. rating is 228.20 USD. The price is lower by -0.14% since the last closing with the lowest point at 226.34 USD and the highest point at 228.26 USD. The deviation from the price is +0.82% for the low point and -0.03% for the high point.The Central Gaps scanner detects a bearish opening. A small advantage for sellers in the very short term.
Bearish opening
Type : Bearish
Timeframe : Openning
So that you have an overall view of the price change, here is a table showing the variations over several periods:
Near a new HIGH record (5 years)
Type : Bullish
Timeframe : Weekly
Near a new HIGH record (1 year)
Type : Bullish
Timeframe : Weekly
Near a new HIGH record (1st january)
Type : Bullish
Timeframe : Weekly
Near a new HIGH record (1 month)
Type : Bullish
Timeframe : Weekly
Technical
Technical analysis of this 1H chart of WASTE MANAGEMENT INC. indicates that the overall trend is strongly bullish. The signals given by moving averages are 89.29% bullish. This strongly bullish trend seems to be running out of steam given the signals being given by short-term moving averages. There is no crossing of moving average by the price or crossing of moving averages between themselves.
In fact, Central Analyzer took into account 18 technical indicators and the result was as follows: 7 are bullish, 5 are neutral and 6 are bearish. Central Indicators, the detector scanner for these technical indicators has recently detected several signals:
RSI indicator is back over 50
Type : Bullish
Timeframe : 1 hour
Price is back over the pivot point
Type : Bullish
Timeframe : Weekly
Williams %R indicator is back over -50
Type : Bullish
Timeframe : 1 hour
Central Patterns, the market scanner focusing on chart patterns, resistances and supports found these results:
Near horizontal support
Type : Bullish
Timeframe : 1 hour
Near support of triangle
Type : Bullish
Timeframe : 1 hour
The presence of these bearish patterns in Japanese candlesticks detected by Central Candlesticks that could cause a correction in the very short term were also noted
Bearish harami
Type : Bearish
Timeframe : 1 hour
Bearish harami cross
Type : Bearish
Timeframe : 1 hour
| S3 | S2 | S1 | Price | |
|---|---|---|---|---|
| ProTrendLines | 218.51 | 221.90 | 227.70 | 228.20 |
| Change (%) | -4.25% | -2.76% | -0.22% | - |
| Change | -9.69 | -6.30 | -0.50 | - |
| Level | Minor | Major | Major | - |
Attention could also be paid to pivot points to set price objectives:
| Pivot points | S3 | S2 | S1 | PP | R1 | R2 | R3 |
|---|---|---|---|---|---|---|---|
| Standard | 225.33 | 226.25 | 227.38 | 228.30 | 229.43 | 230.35 | 231.48 |
| Camarilla | 227.96 | 228.14 | 228.33 | 228.52 | 228.71 | 228.90 | 229.08 |
| Woodie | 225.45 | 226.30 | 227.50 | 228.35 | 229.55 | 230.40 | 231.60 |
| Fibonacci | 226.25 | 227.03 | 227.51 | 228.30 | 229.08 | 229.56 | 230.35 |
| Pivot points | S3 | S2 | S1 | PP | R1 | R2 | R3 |
|---|---|---|---|---|---|---|---|
| Standard | 217.26 | 220.42 | 224.07 | 227.23 | 230.88 | 234.04 | 237.69 |
| Camarilla | 225.86 | 226.48 | 227.11 | 227.73 | 228.35 | 228.98 | 229.60 |
| Woodie | 217.52 | 220.54 | 224.33 | 227.35 | 231.14 | 234.16 | 237.95 |
| Fibonacci | 220.42 | 223.02 | 224.63 | 227.23 | 229.83 | 231.44 | 234.04 |
| Pivot points | S3 | S2 | S1 | PP | R1 | R2 | R3 |
|---|---|---|---|---|---|---|---|
| Standard | 182.68 | 191.19 | 205.72 | 214.23 | 228.76 | 237.27 | 251.80 |
| Camarilla | 213.92 | 216.04 | 218.15 | 220.26 | 222.37 | 224.48 | 226.60 |
| Woodie | 185.70 | 192.70 | 208.74 | 215.74 | 231.78 | 238.78 | 254.82 |
| Fibonacci | 191.19 | 199.99 | 205.43 | 214.23 | 223.03 | 228.47 | 237.27 |
Numerical data
The following are the details of the technical indicators and moving averages that were collected to generate this technical analysis:
| RSI (14): | 51.82 | |
| MACD (12,26,9): | -0.0100 | |
| Directional Movement: | -9.21 | |
| AROON (14): | -71.43 | |
| DEMA (21): | 227.92 | |
| Parabolic SAR (0,02-0,02-0,2): | 228.43 | |
| Elder Ray (13): | 0 | |
| Super Trend (3,10): | 225.96 | |
| Zig ZAG (10): | 228.00 | |
| VORTEX (21): | 0.9600 | |
| Stochastique (14,3,5): | 43.04 | |
| TEMA (21): | 227.50 | |
| Williams %R (14): | -47.08 | |
| Chande Momentum Oscillator (20): | -0.38 | |
| Repulse (5,40,3): | 0.2600 | |
| ROCnROLL: | 1 | |
| TRIX (15,9): | 0.0000 | |
| Courbe Coppock: | 0.96 |
| MA7: | 227.76 | |
| MA20: | 222.00 | |
| MA50: | 213.77 | |
| MA100: | 214.59 | |
| MAexp7: | 227.72 | |
| MAexp20: | 227.86 | |
| MAexp50: | 227.11 | |
| MAexp100: | 224.43 | |
| Price / MA7: | +0.19% | |
| Price / MA20: | +2.79% | |
| Price / MA50: | +6.75% | |
| Price / MA100: | +6.34% | |
| Price / MAexp7: | +0.21% | |
| Price / MAexp20: | +0.15% | |
| Price / MAexp50: | +0.48% | |
| Price / MAexp100: | +1.68% |
News
Don't forget to follow the news on WASTE MANAGEMENT INC.. At the time of publication of this analysis, the latest news was as follows:
- Blue Planet Expands Global Leadership in Sustainable Waste Management with Acquisition of Smart Environmental
- The Clean Cities And Urban Development Forum 2024 - Driving Innovation For Sustainable Waste Management & Urban Development
- EQS-News: Saudi Arabia Ventures into Sustainable Waste Management
- EQS-News: Saudi Arabia's path to Circular Economy: National Center for waste management presents it's investment opportunities for the first time at IFAT 2024 in Munich
- EQS-News: From oil exporter to pioneer of the circular economy - Saudi Arabia for the first time at the leading waste trade fair IFAT 2024 in Munich
About author
Online


Add a comment
Comments
0 comments on the analysis WASTE MANAGEMENT INC. - 1H