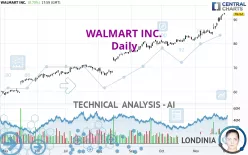
WALMART INC. - Daily - Technical analysis published on 12/01/2024 (GMT)
- 244
- 0
- Timeframe : Daily
- - Analysis generated on
- Status : WITHOUT TARGET

Summary of the analysis

Additional analysis
Quotes
The WALMART INC. rating is 92.52 USD. On the day, this instrument gained +0.70% with the lowest point at 91.82 USD and the highest point at 92.64 USD. The deviation from the price is +0.76% for the low point and -0.13% for the high point.The Central Gaps scanner detects a bullish gap which is a sign that buyers have taken the lead in the very short term.
Opening Gap UP
Type : Bullish
Timeframe : Openning
So that you have an overall view of the price change, here is a table showing the variations over several periods:
New HIGH record (5 years)
Type : Bullish
Timeframe : Weekly
New HIGH record (1 year)
Type : Bullish
Timeframe : Weekly
New HIGH record (1st january)
Type : Bullish
Timeframe : Weekly
New HIGH record (1 month)
Type : Bullish
Timeframe : Weekly
Technical
Technical analysis of this Daily chart of WALMART INC. indicates that the overall trend is strongly bullish. The signals given by the moving averages are 92.86% bullish. This strong bullish trend is confirmed by the strong signals currently being given by short-term moving averages. There is no crossing of moving average by the price or crossing of moving averages between themselves.
Technical indicators are strongly bullish, suggesting that the price increase should continue.
Caution: the Central Indicators scanner currently detects an excess:
RSI indicator is overbought : over 70
Type : Neutral
Timeframe : Daily
CCI indicator is overbought : over 100
Type : Neutral
Timeframe : Daily
Williams %R indicator is overbought : over -20
Type : Neutral
Timeframe : Daily
Pivot points : price is over resistance 1
Type : Neutral
Timeframe : Daily
The Central Patterns scanner, which studies chart patterns, resistances and supports, has identified this signal:
Near resistance of channel
Type : Bearish
Timeframe : Daily
The Central Candlesticks scanner which studies Japanese candlesticks did not detect anything.
| S3 | S2 | S1 | Price | |
|---|---|---|---|---|
| ProTrendLines | 70.83 | 81.43 | 85.50 | 92.52 |
| Change (%) | -23.44% | -11.99% | -7.59% | - |
| Change | -21.69 | -11.09 | -7.02 | - |
| Level | Intermediate | Intermediate | Major | - |
To determine price objectives, it is also possible to use the pivot points. Here is the price position in relation to pivot points:
| Pivot points | S3 | S2 | S1 | PP | R1 | R2 | R3 |
|---|---|---|---|---|---|---|---|
| Standard | 91.19 | 91.51 | 92.01 | 92.33 | 92.83 | 93.15 | 93.65 |
| Camarilla | 92.30 | 92.37 | 92.45 | 92.52 | 92.60 | 92.67 | 92.75 |
| Woodie | 91.29 | 91.56 | 92.11 | 92.38 | 92.93 | 93.20 | 93.75 |
| Fibonacci | 91.51 | 91.82 | 92.01 | 92.33 | 92.64 | 92.83 | 93.15 |
| Pivot points | S3 | S2 | S1 | PP | R1 | R2 | R3 |
|---|---|---|---|---|---|---|---|
| Standard | 86.59 | 87.83 | 90.17 | 91.41 | 93.75 | 94.99 | 97.33 |
| Camarilla | 91.54 | 91.86 | 92.19 | 92.52 | 92.85 | 93.18 | 93.51 |
| Woodie | 87.15 | 88.11 | 90.73 | 91.69 | 94.31 | 95.27 | 97.89 |
| Fibonacci | 87.83 | 89.19 | 90.04 | 91.41 | 92.77 | 93.62 | 94.99 |
| Pivot points | S3 | S2 | S1 | PP | R1 | R2 | R3 |
|---|---|---|---|---|---|---|---|
| Standard | 75.15 | 77.06 | 79.51 | 81.42 | 83.87 | 85.78 | 88.23 |
| Camarilla | 80.75 | 81.15 | 81.55 | 81.95 | 82.35 | 82.75 | 83.15 |
| Woodie | 75.41 | 77.20 | 79.77 | 81.56 | 84.13 | 85.92 | 88.49 |
| Fibonacci | 77.06 | 78.73 | 79.76 | 81.42 | 83.09 | 84.12 | 85.78 |
Numerical data
The following are the details of the technical indicators and moving averages that were collected to generate this technical analysis:
| RSI (14): | 78.37 | |
| MACD (12,26,9): | 2.5600 | |
| Directional Movement: | 35.84 | |
| AROON (14): | 57.14 | |
| DEMA (21): | 90.20 | |
| Parabolic SAR (0,02-0,02-0,2): | 87.79 | |
| Elder Ray (13): | 3.73 | |
| Super Trend (3,10): | 87.55 | |
| Zig ZAG (10): | 92.52 | |
| VORTEX (21): | 1.2100 | |
| Stochastique (14,3,5): | 95.87 | |
| TEMA (21): | 91.38 | |
| Williams %R (14): | -1.34 | |
| Chande Momentum Oscillator (20): | 7.53 | |
| Repulse (5,40,3): | 1.4700 | |
| ROCnROLL: | 1 | |
| TRIX (15,9): | 0.3200 | |
| Courbe Coppock: | 15.02 |
| MA7: | 90.17 | |
| MA20: | 86.29 | |
| MA50: | 83.09 | |
| MA100: | 78.04 | |
| MAexp7: | 90.24 | |
| MAexp20: | 87.10 | |
| MAexp50: | 83.39 | |
| MAexp100: | 78.73 | |
| Price / MA7: | +2.61% | |
| Price / MA20: | +7.22% | |
| Price / MA50: | +11.35% | |
| Price / MA100: | +18.55% | |
| Price / MAexp7: | +2.53% | |
| Price / MAexp20: | +6.22% | |
| Price / MAexp50: | +10.95% | |
| Price / MAexp100: | +17.52% |
News
Don't forget to follow the news on WALMART INC.. At the time of publication of this analysis, the latest news was as follows:
-
 Walmart will ‘set the standard’ for other companies: Kennedy
-
‘Punished at the store level’: Kevin O’Leary on Walmart scaling back DEI initiatives
- Walmart Canada and DoorDash Canada Join Forces To Bring Everyday Low Prices To More Canadians
-
Walmart says this Trump trade policy could lead to higher prices
- Walmart reports strong revenue growth of 5.5% with operating income growing faster at 8.2%
About author

Online


Add a comment
Comments
0 comments on the analysis WALMART INC. - Daily