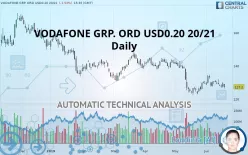
VODAFONE GRP. ORD USD0.20 20/21 - Daily - Technical analysis published on 06/19/2019 (GMT)
- 337
- 0
Click here for a new analysis!
- Timeframe : Daily
- - Analysis generated on
- Status : TARGET REACHED

Summary of the analysis

Additional analysis
Quotes
The VODAFONE GRP. ORD USD0.20 20/21 price is 127.20 GBX. The price is lower by -1.53% since the last closing with the lowest point at 126.38 GBX and the highest point at 128.86 GBX. The deviation from the price is +0.65% for the low point and -1.29% for the high point.The Central Gaps scanner detects a bullish opening marking the presence of sellers ahead of buyers at the opening but not sufficiently marked to allow the price to register a quotation gap.
Bearish opening
Type : Bearish
Timeframe : Openning
Here is a more detailed summary of the historical variations registered by VODAFONE GRP. ORD USD0.20 20/21:
Near a new HIGH record (1 month)
Type : Bullish
Timeframe : Weekly
Technical
A technical analysis in Daily of this VODAFONE GRP. ORD USD0.20 20/21 chart shows a sharp bearish trend. 82.14% of the signals given by moving averages are bearish. Caution: as the signals currently given by short-term moving averages are rather neutral, the strongly bearish trend is showing signs of running out of steam. The Central Indicators scanner does not detect any result on moving averages that would impact this trend.
The technical indicators are generally neutral. They do not provide relevant information on the direction of future price movements.
Other results related to technical indicators were also found by the Central Indicators scanner:
Pivot points : price is under support 1
Type : Neutral
Timeframe : Daily
RSI indicator is back over 50
Type : Bullish
Timeframe : Daily
Price is back over the pivot point
Type : Bullish
Timeframe : Daily
Price is back under the pivot point
Type : Bearish
Timeframe : Weekly
Central Patterns, the market scanner focusing on chart patterns, resistances and supports found this result:
Near support of channel
Type : Bullish
Timeframe : Daily
The presence of a bullish Japanese candlestick pattern detected by Central Candlesticks that could cause a very short term rebound was also detected:
Bullish engulfing lines
Type : Bullish
Timeframe : Daily
| S2 | S1 | Price | R1 | R2 | R3 | |
|---|---|---|---|---|---|---|
| ProTrendLines | 109.11 | 123.32 | 127.20 | 131.36 | 146.76 | 154.89 |
| Change (%) | -14.22% | -3.05% | - | +3.27% | +15.38% | +21.77% |
| Change | -18.09 | -3.88 | - | +4.16 | +19.56 | +27.69 |
| Level | Intermediate | Intermediate | - | Major | Intermediate | Major |
Pivot points can also be used to set your price objectives. Here is the price situation in relation to pivot points:
| Pivot points | S3 | S2 | S1 | PP | R1 | R2 | R3 |
|---|---|---|---|---|---|---|---|
| Standard | 124.05 | 125.45 | 127.31 | 128.71 | 130.57 | 131.97 | 133.83 |
| Camarilla | 128.28 | 128.58 | 128.88 | 129.18 | 129.48 | 129.78 | 130.08 |
| Woodie | 124.29 | 125.57 | 127.55 | 128.82 | 130.81 | 132.09 | 134.07 |
| Fibonacci | 125.45 | 126.69 | 127.46 | 128.71 | 129.95 | 130.72 | 131.97 |
| Pivot points | S3 | S2 | S1 | PP | R1 | R2 | R3 |
|---|---|---|---|---|---|---|---|
| Standard | 122.74 | 125.26 | 126.64 | 129.16 | 130.54 | 133.06 | 134.44 |
| Camarilla | 126.95 | 127.31 | 127.66 | 128.02 | 128.38 | 128.74 | 129.09 |
| Woodie | 122.17 | 124.97 | 126.07 | 128.88 | 129.97 | 132.77 | 133.87 |
| Fibonacci | 125.26 | 126.75 | 127.67 | 129.16 | 130.65 | 131.57 | 133.06 |
Numerical data
The following is the status of technical indicators and moving averages registered at the time this technical analysis was created:
| RSI (14): | 45.79 | |
| MACD (12,26,9): | -0.3200 | |
| Directional Movement: | 0.28 | |
| AROON (14): | 57.14 | |
| DEMA (21): | 127.44 | |
| Parabolic SAR (0,02-0,02-0,2): | 131.48 | |
| Elder Ray (13): | -0.55 | |
| Super Trend (3,10): | 122.89 | |
| Zig ZAG (10): | 127.20 | |
| VORTEX (21): | 1.1100 | |
| Stochastique (14,3,5): | 51.23 | |
| TEMA (21): | 128.67 | |
| Williams %R (14): | -65.69 | |
| Chande Momentum Oscillator (20): | 0.84 | |
| Repulse (5,40,3): | -0.8700 | |
| ROCnROLL: | 2 | |
| TRIX (15,9): | -0.0800 | |
| Courbe Coppock: | 6.40 |
| MA7: | 128.63 | |
| MA20: | 127.03 | |
| MA50: | 131.06 | |
| MA100: | 133.44 | |
| MAexp7: | 128.28 | |
| MAexp20: | 128.21 | |
| MAexp50: | 130.39 | |
| MAexp100: | 134.51 | |
| Price / MA7: | -1.11% | |
| Price / MA20: | +0.13% | |
| Price / MA50: | -2.95% | |
| Price / MA100: | -4.68% | |
| Price / MAexp7: | -0.84% | |
| Price / MAexp20: | -0.79% | |
| Price / MAexp50: | -2.45% | |
| Price / MAexp100: | -5.43% |
About author

Online


Add a comment
Comments
0 comments on the analysis VODAFONE GRP. ORD USD0.20 20/21 - Daily