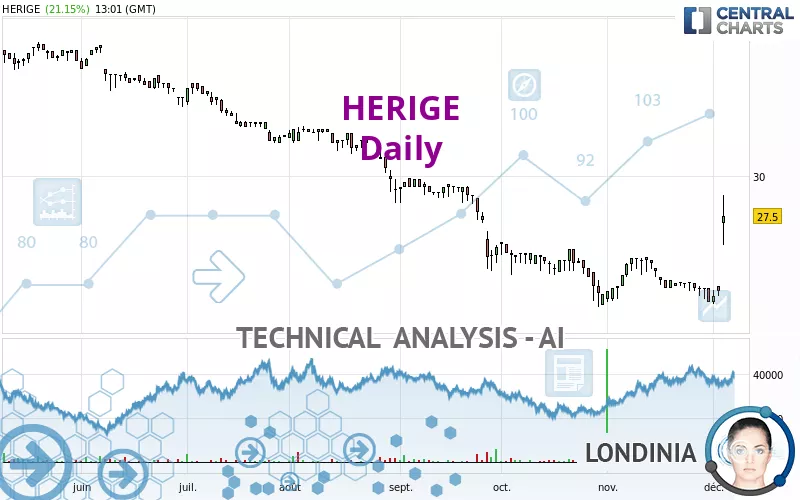
HERIGE - Daily - Technical analysis published on 12/05/2023 (GMT)
- 143
- 0
Click here for a new analysis!
- Timeframe : Daily
- - Analysis generated on
- Status : TARGET REACHED

Summary of the analysis

Additional analysis
Quotes
The HERIGE price is 27.5 EUR. The price registered an increase of +21.15% on the session and was traded between 25.6 EUR and 28.8 EUR over the period. The price is currently at +7.42% from its lowest and -4.51% from its highest.The Central Gaps scanner detects a bullish gap which is a sign that buyers have taken the lead in the very short term.
Opening Gap UP
Type : Bullish
Timeframe : Openning
Here is a more detailed summary of the historical variations registered by HERIGE:
New HIGH record (1 month)
Type : Bullish
Timeframe : Weekly
The Central Volumes scanner notes the presence of abnormal volumes:
Abnormal volumes
Timeframe : 5 days
Technical
Technical analysis of HERIGE in Daily shows an overall slightly bullish trend. 57.14% of the signals given by moving averages are bullish. This slightly bullish trend could be reinforced by the strong bullish signals given by short-term moving averages. An assessment of moving averages reveals several bullish signals that could impact this trend:
Bullish price crossover with Moving Average 20
Type : Bullish
Timeframe : Daily
Bullish price crossover with Moving Average 50
Type : Bullish
Timeframe : Daily
Bullish price crossover with adaptative moving average 20
Type : Bullish
Timeframe : Daily
Bullish price crossover with adaptative moving average 50
Type : Bullish
Timeframe : Daily
Bullish price crossover with adaptative moving average 100
Type : Bullish
Timeframe : Daily
An assessment of technical indicators shows a moderate bullish signal.
Caution: the Central Indicators scanner currently detects an excess:
RSI indicator is overbought : over 70
Type : Neutral
Timeframe : Daily
CCI indicator is overbought : over 100
Type : Neutral
Timeframe : Daily
Pivot points : price is over resistance 3
Type : Neutral
Timeframe : Daily
Pivot points : price is over resistance 3
Type : Neutral
Timeframe : Weekly
MACD crosses UP its Moving Average
Type : Bullish
Timeframe : Daily
Parabolic SAR indicator bullish reversal
Type : Bullish
Timeframe : Daily
Aroon indicator bullish trend
Type : Bullish
Timeframe : Daily
SuperTrend indicator bullish reversal
Type : Bullish
Timeframe : Daily
Ichimoku - Bullish crossover : Tenkan & Kijun
Type : Bullish
Timeframe : Daily
Momentum indicator is back over 0
Type : Bullish
Timeframe : Daily
Williams %R indicator is back over -50
Type : Bullish
Timeframe : Daily
An analysis of the price chart with the Central Patterns scanner (detector of chart patterns and resistances and supports) shows several results that can have an impact on the price change:
Horizontal resistance is broken
Type : Bullish
Timeframe : Daily
Resistance of channel is broken
Type : Bullish
Timeframe : Daily
Central Candlesticks, the scanner specialised in Japanese candlesticks, detects a bullish signal that could support the hypothesis of a small rebound in the very short term:
Long white line
Type : Bullish
Timeframe : Daily
| S3 | S2 | S1 | Price | R1 | R2 | R3 | |
|---|---|---|---|---|---|---|---|
| ProTrendLines | 19.3 | 22.9 | 24.8 | 27.5 | 28.7 | 33.4 | 37.8 |
| Change (%) | -29.82% | -16.73% | -9.82% | - | +4.36% | +21.45% | +37.45% |
| Change | -8.2 | -4.6 | -2.7 | - | +1.2 | +5.9 | +10.3 |
| Level | Major | Minor | Intermediate | - | Major | Minor | Major |
To determine price objectives, it is also possible to use the pivot points. Here is the price position in relation to pivot points:
| Pivot points | S3 | S2 | S1 | PP | R1 | R2 | R3 |
|---|---|---|---|---|---|---|---|
| Standard | 21.8 | 22.1 | 22.4 | 22.7 | 23.0 | 23.3 | 23.6 |
| Camarilla | 22.5 | 22.6 | 22.7 | 22.7 | 22.8 | 22.8 | 22.9 |
| Woodie | 21.8 | 22.1 | 22.4 | 22.7 | 23.0 | 23.3 | 23.6 |
| Fibonacci | 22.1 | 22.3 | 22.5 | 22.7 | 22.9 | 23.1 | 23.3 |
| Pivot points | S3 | S2 | S1 | PP | R1 | R2 | R3 |
|---|---|---|---|---|---|---|---|
| Standard | 20.5 | 21.2 | 21.8 | 22.5 | 23.1 | 23.8 | 24.4 |
| Camarilla | 22.0 | 22.2 | 22.3 | 22.4 | 22.5 | 22.6 | 22.8 |
| Woodie | 20.5 | 21.2 | 21.8 | 22.5 | 23.1 | 23.8 | 24.4 |
| Fibonacci | 21.2 | 21.7 | 22.0 | 22.5 | 23.0 | 23.3 | 23.8 |
| Pivot points | S3 | S2 | S1 | PP | R1 | R2 | R3 |
|---|---|---|---|---|---|---|---|
| Standard | 18.1 | 20.1 | 21.0 | 23.0 | 23.9 | 25.9 | 26.8 |
| Camarilla | 21.2 | 21.5 | 21.7 | 22.0 | 22.3 | 22.5 | 22.8 |
| Woodie | 17.7 | 19.8 | 20.6 | 22.7 | 23.5 | 25.6 | 26.4 |
| Fibonacci | 20.1 | 21.2 | 21.9 | 23.0 | 24.1 | 24.8 | 25.9 |
Numerical data
The following are the details of the technical indicators and moving averages that were collected to generate this technical analysis:
| RSI (14): | 72.80 | |
| MACD (12,26,9): | -0.1000 | |
| Directional Movement: | 30.3 | |
| AROON (14): | 14.3 | |
| DEMA (21): | 23.3 | |
| Parabolic SAR (0,02-0,02-0,2): | 21.9 | |
| Elder Ray (13): | 3.6 | |
| Super Trend (3,10): | 23.5 | |
| Zig ZAG (10): | 27.5 | |
| VORTEX (21): | 0.9000 | |
| Stochastique (14,3,5): | 44.60 | |
| TEMA (21): | 23.8 | |
| Williams %R (14): | -18.80 | |
| Chande Momentum Oscillator (20): | 4.1 | |
| Repulse (5,40,3): | 1.8000 | |
| ROCnROLL: | 1 | |
| TRIX (15,9): | -0.2000 | |
| Courbe Coppock: | 4.50 |
| MA7: | 23.3 | |
| MA20: | 23.7 | |
| MA50: | 24.1 | |
| MA100: | 27.6 | |
| MAexp7: | 23.9 | |
| MAexp20: | 23.6 | |
| MAexp50: | 24.8 | |
| MAexp100: | 27.0 | |
| Price / MA7: | +18.03% | |
| Price / MA20: | +16.03% | |
| Price / MA50: | +14.11% | |
| Price / MA100: | -0.36% | |
| Price / MAexp7: | +15.06% | |
| Price / MAexp20: | +16.53% | |
| Price / MAexp50: | +10.89% | |
| Price / MAexp100: | +1.85% |
News
Don't forget to follow the news on HERIGE. At the time of publication of this analysis, the latest news was as follows:
- TURNOVER AT SEPTEMBER 30, 2023: EUR 638.1 MILLION
- FIRST-HALF 2023 RESULTS
- HERIGE sets its climate targets for 2030, approved by the Science Based Targets initiative (SBTi)
- FIRST-HALF 2023 TURNOVER: EUR 455.0 MILLION
- TURNOVER AT MARCH 31, 2023 EUR 227.1 MILLION
About author
Online


Add a comment
Comments
0 comments on the analysis HERIGE - Daily