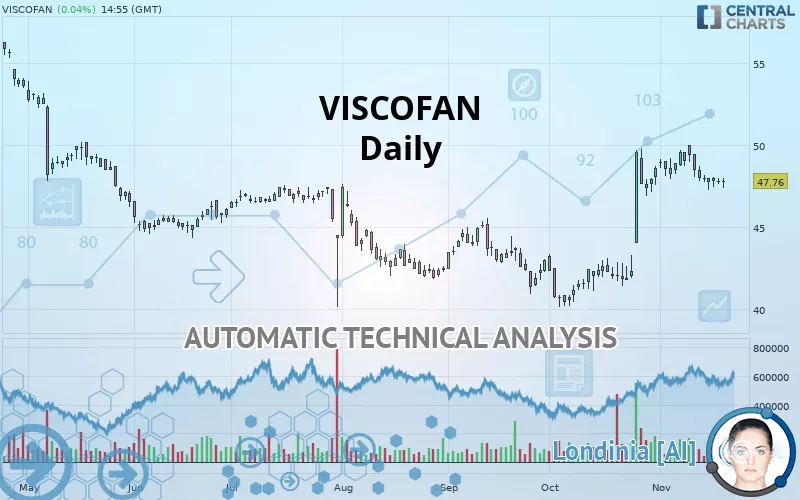
VISCOFAN - Daily - Technical analysis published on 11/20/2019 (GMT)
- 245
- 0
- Who voted?
Click here for a new analysis!
- Timeframe : Daily
- - Analysis generated on
- Status : LEVEL MAINTAINED
Summary of the analysis

Additional analysis
Quotes
VISCOFAN rating 47.76 EUR. The price has increased by +0.04% since the last closing with the lowest point at 47.34 EUR and the highest point at 47.98 EUR. The deviation from the price is +0.89% for the low point and -0.46% for the high point.The Central Gaps scanner detects a bearish opening marking the presence of sellers ahead of buyers at the opening but not sufficiently marked to allow the price to register a quotation gap.
Bearish opening
Type : Bearish
Timeframe : Openning
A study of price movements over other periods shows the following variations:
Near a new HIGH record (1 month)
Type : Bullish
Timeframe : Weekly
Technical
Technical analysis of this Daily chart of VISCOFAN indicates that the overall trend is strongly bullish. 82.14% of the signals given by moving averages are bullish. The slightly bullish signals given by the short-term moving averages show a weakening of the global trend. The Central Indicators scanner detects a bearish signal on moving averages that could impact this trend:
Bearish price crossover with Moving Average 20
Type : Bearish
Timeframe : Daily
An assessment of technical indicators does not currently provide any relevant information to suggest whether the signal given by the technical indicators is more bullish or bearish.
But beware of excesses. The Central Indicators scanner currently detects this:
Williams %R indicator is oversold : under -80
Type : Neutral
Timeframe : Daily
Price is back under the pivot point
Type : Bearish
Timeframe : Daily
Price is back under the pivot point
Type : Bearish
Timeframe : Weekly
Central Patterns, the scanner specializing in chart patterns, did not identify any signals.
The Central Candlesticks scanner which studies Japanese candlesticks did not detect anything.
| S3 | S2 | S1 | Price | R1 | R2 | R3 | |
|---|---|---|---|---|---|---|---|
| ProTrendLines | 42.56 | 44.82 | 46.52 | 47.76 | 49.54 | 51.90 | 54.35 |
| Change (%) | -10.89% | -6.16% | -2.60% | - | +3.73% | +8.67% | +13.80% |
| Change | -5.20 | -2.94 | -1.24 | - | +1.78 | +4.14 | +6.59 |
| Level | Major | Intermediate | Major | - | Major | Intermediate | Minor |
Pivot points can also be used to set your price objectives. Here is the price situation in relation to pivot points:
| Pivot points | S3 | S2 | S1 | PP | R1 | R2 | R3 |
|---|---|---|---|---|---|---|---|
| Standard | 47.15 | 47.37 | 47.55 | 47.77 | 47.95 | 48.17 | 48.35 |
| Camarilla | 47.63 | 47.67 | 47.70 | 47.74 | 47.78 | 47.81 | 47.85 |
| Woodie | 47.14 | 47.36 | 47.54 | 47.76 | 47.94 | 48.16 | 48.34 |
| Fibonacci | 47.37 | 47.52 | 47.61 | 47.77 | 47.92 | 48.01 | 48.17 |
| Pivot points | S3 | S2 | S1 | PP | R1 | R2 | R3 |
|---|---|---|---|---|---|---|---|
| Standard | 43.85 | 45.53 | 46.63 | 48.31 | 49.41 | 51.09 | 52.19 |
| Camarilla | 46.96 | 47.21 | 47.47 | 47.72 | 47.98 | 48.23 | 48.49 |
| Woodie | 43.55 | 45.39 | 46.33 | 48.17 | 49.11 | 50.95 | 51.89 |
| Fibonacci | 45.53 | 46.60 | 47.25 | 48.31 | 49.38 | 50.03 | 51.09 |
| Pivot points | S3 | S2 | S1 | PP | R1 | R2 | R3 |
|---|---|---|---|---|---|---|---|
| Standard | 32.97 | 36.55 | 42.57 | 46.15 | 52.17 | 55.75 | 61.77 |
| Camarilla | 45.94 | 46.82 | 47.70 | 48.58 | 49.46 | 50.34 | 51.22 |
| Woodie | 34.18 | 37.16 | 43.78 | 46.76 | 53.38 | 56.36 | 62.98 |
| Fibonacci | 36.55 | 40.22 | 42.49 | 46.15 | 49.82 | 52.09 | 55.75 |
Numerical data
The following is the status of technical indicators and moving averages registered at the time this technical analysis was created:
| RSI (14): | 57.02 | |
| MACD (12,26,9): | 1.0000 | |
| Directional Movement: | 7.55 | |
| AROON (14): | -28.57 | |
| DEMA (21): | 48.81 | |
| Parabolic SAR (0,02-0,02-0,2): | 49.42 | |
| Elder Ray (13): | -0.17 | |
| Super Trend (3,10): | 45.87 | |
| Zig ZAG (10): | 47.68 | |
| VORTEX (21): | 1.1600 | |
| Stochastique (14,3,5): | 19.34 | |
| TEMA (21): | 48.92 | |
| Williams %R (14): | -83.45 | |
| Chande Momentum Oscillator (20): | -0.82 | |
| Repulse (5,40,3): | -0.5700 | |
| ROCnROLL: | -1 | |
| TRIX (15,9): | 0.4500 | |
| Courbe Coppock: | 3.60 |
| MA7: | 47.92 | |
| MA20: | 48.09 | |
| MA50: | 44.57 | |
| MA100: | 44.72 | |
| MAexp7: | 47.95 | |
| MAexp20: | 47.33 | |
| MAexp50: | 45.76 | |
| MAexp100: | 45.53 | |
| Price / MA7: | -0.33% | |
| Price / MA20: | -0.69% | |
| Price / MA50: | +7.16% | |
| Price / MA100: | +6.80% | |
| Price / MAexp7: | -0.40% | |
| Price / MAexp20: | +0.91% | |
| Price / MAexp50: | +4.37% | |
| Price / MAexp100: | +4.90% |
About author

Online


Add a comment
Comments
0 comments on the analysis VISCOFAN - Daily