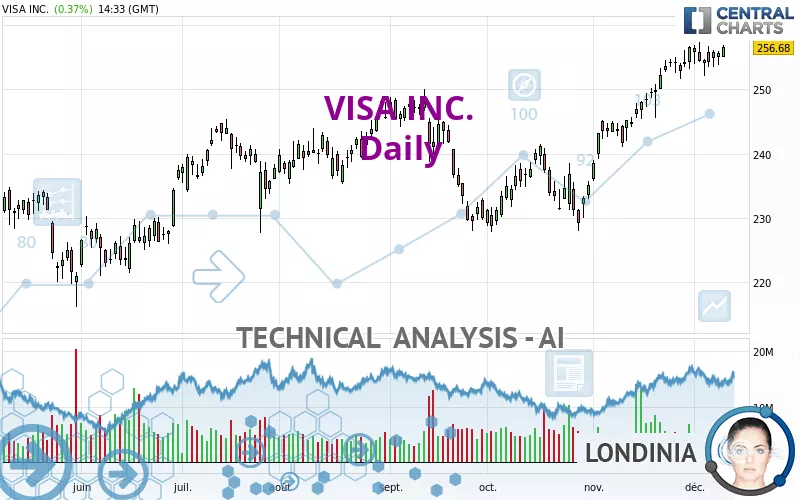
VISA INC. - Daily - Technical analysis published on 12/11/2023 (GMT)
- 176
- 0
Click here for a new analysis!
- Timeframe : Daily
- - Analysis generated on
- Status : LEVEL MAINTAINED

Summary of the analysis

Additional analysis
Quotes
VISA INC. rating 256.68 USD. The price has increased by +0.37% since the last closing and was between 255.00 USD and 256.90 USD. This implies that the price is at +0.66% from its lowest and at -0.09% from its highest.The Central Gaps scanner detects a bearish opening. A small advantage for sellers in the very short term.
Bearish opening
Type : Bearish
Timeframe : Openning
So that you have an overall view of the price change, here is a table showing the variations over several periods:
New HIGH record (5 years)
Type : Bullish
Timeframe : Weekly
Near a new HIGH record (1 year)
Type : Bullish
Timeframe : Weekly
Near a new HIGH record (1st january)
Type : Bullish
Timeframe : Weekly
Near a new HIGH record (1 month)
Type : Bullish
Timeframe : Weekly
Technical
A technical analysis in Daily of this VISA INC. chart shows a strongly bullish trend. 92.86% of the signals given by moving averages are bullish. The overall trend is supported by the strong bullish signals from short-term moving averages. There is no crossing of moving average by the price or crossing of moving averages between themselves.
An assessment of technical indicators shows a moderate bullish signal.
Caution: the Central Indicators scanner currently detects an excess:
Williams %R indicator is overbought : over -20
Type : Neutral
Timeframe : Daily
Price is back over the pivot point
Type : Bullish
Timeframe : Daily
Central Patterns, the market scanner focusing on chart patterns, resistances and supports found these results:
Near horizontal resistance
Type : Bearish
Timeframe : Daily
Near support of channel
Type : Bullish
Timeframe : Daily
The Central Candlesticks scanner which studies Japanese candlesticks did not detect anything.
| S3 | S2 | S1 | R1 | Price | |
|---|---|---|---|---|---|
| ProTrendLines | 228.78 | 233.31 | 245.26 | 256.68 | 256.68 |
| Change (%) | -10.87% | -9.10% | -4.45% | 0% | - |
| Change | -27.90 | -23.37 | -11.42 | 0 | - |
| Level | Intermediate | Intermediate | Major | Major | - |
Attention could also be paid to pivot points to set price objectives:
| Pivot points | S3 | S2 | S1 | PP | R1 | R2 | R3 |
|---|---|---|---|---|---|---|---|
| Standard | 252.22 | 253.05 | 254.39 | 255.22 | 256.56 | 257.39 | 258.73 |
| Camarilla | 255.14 | 255.34 | 255.54 | 255.74 | 255.94 | 256.14 | 256.34 |
| Woodie | 252.49 | 253.18 | 254.66 | 255.35 | 256.83 | 257.52 | 259.00 |
| Fibonacci | 253.05 | 253.88 | 254.39 | 255.22 | 256.05 | 256.56 | 257.39 |
| Pivot points | S3 | S2 | S1 | PP | R1 | R2 | R3 |
|---|---|---|---|---|---|---|---|
| Standard | 247.54 | 249.84 | 252.79 | 255.09 | 258.04 | 260.34 | 263.29 |
| Camarilla | 254.30 | 254.78 | 255.26 | 255.74 | 256.22 | 256.70 | 257.18 |
| Woodie | 247.87 | 250.00 | 253.12 | 255.25 | 258.37 | 260.50 | 263.62 |
| Fibonacci | 249.84 | 251.85 | 253.09 | 255.09 | 257.10 | 258.34 | 260.34 |
| Pivot points | S3 | S2 | S1 | PP | R1 | R2 | R3 |
|---|---|---|---|---|---|---|---|
| Standard | 220.73 | 227.95 | 242.32 | 249.54 | 263.91 | 271.13 | 285.50 |
| Camarilla | 250.74 | 252.72 | 254.70 | 256.68 | 258.66 | 260.64 | 262.62 |
| Woodie | 224.30 | 229.74 | 245.89 | 251.33 | 267.48 | 272.92 | 289.07 |
| Fibonacci | 227.95 | 236.20 | 241.30 | 249.54 | 257.79 | 262.89 | 271.13 |
Numerical data
The following is the status of technical indicators and moving averages registered at the time this technical analysis was created:
| RSI (14): | 67.84 | |
| MACD (12,26,9): | 3.8100 | |
| Directional Movement: | 11.02 | |
| AROON (14): | 64.29 | |
| DEMA (21): | 256.86 | |
| Parabolic SAR (0,02-0,02-0,2): | 257.18 | |
| Elder Ray (13): | 1.31 | |
| Super Trend (3,10): | 246.97 | |
| Zig ZAG (10): | 255.74 | |
| VORTEX (21): | 1.1500 | |
| Stochastique (14,3,5): | 82.13 | |
| TEMA (21): | 257.88 | |
| Williams %R (14): | -13.99 | |
| Chande Momentum Oscillator (20): | 3.51 | |
| Repulse (5,40,3): | 0.9400 | |
| ROCnROLL: | 1 | |
| TRIX (15,9): | 0.2500 | |
| Courbe Coppock: | 5.59 |
| MA7: | 255.43 | |
| MA20: | 252.13 | |
| MA50: | 242.33 | |
| MA100: | 241.11 | |
| MAexp7: | 255.00 | |
| MAexp20: | 251.68 | |
| MAexp50: | 245.91 | |
| MAexp100: | 241.29 | |
| Price / MA7: | +0.49% | |
| Price / MA20: | +1.80% | |
| Price / MA50: | +5.92% | |
| Price / MA100: | +6.46% | |
| Price / MAexp7: | +0.66% | |
| Price / MAexp20: | +1.99% | |
| Price / MAexp50: | +4.38% | |
| Price / MAexp100: | +6.38% |
About author

Online


Add a comment
Comments
0 comments on the analysis VISA INC. - Daily