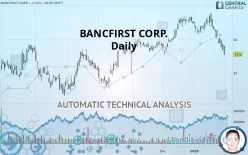
BANCFIRST CORP. - Daily - Technical analysis published on 02/03/2020 (GMT)
- 427
- 0
- Who voted?
Click here for a new analysis!
- Timeframe : Daily
- - Analysis generated on
- Status : INVALID

Summary of the analysis

Additional analysis
Quotes
The BANCFIRST CORP. price is 57.80 USD. On the day, this instrument lost -2.66% with the lowest point at 57.69 USD and the highest point at 59.02 USD. The deviation from the price is +0.19% for the low point and -2.07% for the high point.So that you have an overall view of the price change, here is a table showing the variations over several periods:
Technical
A technical analysis in Daily of this BANCFIRST CORP. chart shows a slightly bearish trend. 60.71% of the signals given by moving averages are bearish. This slightly bearish trend could be reinforced by the strong bearish signals given by short-term moving averages. The Central Indicators market scanner is currently detecting a bullish signal that could impact this trend:
Bullish price crossover with adaptative moving average 100
Type : Bullish
Timeframe : Daily
In fact, according to the parameters integrated into the Central Analyzer system, 14 technical indicators out of 18 analysed are currently bearish. Caution: the Central Indicators scanner currently detects an excess:
CCI indicator is oversold : under -100
Type : Neutral
Timeframe : Daily
Previous candle closed under Bollinger bands
Type : Neutral
Timeframe : Daily
CCI indicator: bullish divergence
Type : Bullish
Timeframe : Daily
Williams %R indicator is oversold : under -80
Type : Neutral
Timeframe : Daily
Pivot points : price is under support 3
Type : Neutral
Timeframe : Daily
Pivot points : price is under support 3
Type : Neutral
Timeframe : Weekly
Price is back over the pivot point
Type : Bullish
Timeframe : Daily
Central Patterns, the market scanner focusing on chart patterns, resistances and supports found this result:
Near support of channel
Type : Bullish
Timeframe : Daily
Central Candlesticks, the scanner specialised in Japanese candlesticks, detects a bullish signal that could support the hypothesis of a small rebound in the very short term:
Piercing line
Type : Bullish
Timeframe : Daily
| S3 | S2 | S1 | Price | R1 | R2 | R3 | |
|---|---|---|---|---|---|---|---|
| ProTrendLines | 51.88 | 54.65 | 55.80 | 57.80 | 58.17 | 59.35 | 61.20 |
| Change (%) | -10.24% | -5.45% | -3.46% | - | +0.64% | +2.68% | +5.88% |
| Change | -5.92 | -3.15 | -2.00 | - | +0.37 | +1.55 | +3.40 |
| Level | Major | Minor | Minor | - | Major | Major | Intermediate |
To determine price objectives, it is also possible to use the pivot points. Here is the price position in relation to pivot points:
| Pivot points | S3 | S2 | S1 | PP | R1 | R2 | R3 |
|---|---|---|---|---|---|---|---|
| Standard | 57.58 | 57.94 | 58.66 | 59.02 | 59.74 | 60.10 | 60.82 |
| Camarilla | 59.08 | 59.18 | 59.28 | 59.38 | 59.48 | 59.58 | 59.68 |
| Woodie | 57.76 | 58.03 | 58.84 | 59.11 | 59.92 | 60.19 | 61.00 |
| Fibonacci | 57.94 | 58.35 | 58.61 | 59.02 | 59.43 | 59.69 | 60.10 |
| Pivot points | S3 | S2 | S1 | PP | R1 | R2 | R3 |
|---|---|---|---|---|---|---|---|
| Standard | 56.28 | 58.16 | 59.34 | 61.22 | 62.40 | 64.28 | 65.46 |
| Camarilla | 59.67 | 59.95 | 60.23 | 60.51 | 60.79 | 61.07 | 61.35 |
| Woodie | 55.92 | 57.99 | 58.98 | 61.05 | 62.04 | 64.11 | 65.10 |
| Fibonacci | 58.16 | 59.33 | 60.05 | 61.22 | 62.39 | 63.11 | 64.28 |
| Pivot points | S3 | S2 | S1 | PP | R1 | R2 | R3 |
|---|---|---|---|---|---|---|---|
| Standard | 52.77 | 55.09 | 58.76 | 61.08 | 64.75 | 67.07 | 70.75 |
| Camarilla | 60.79 | 61.34 | 61.89 | 62.44 | 62.99 | 63.54 | 64.09 |
| Woodie | 53.45 | 55.43 | 59.44 | 61.42 | 65.44 | 67.41 | 71.43 |
| Fibonacci | 55.09 | 57.37 | 58.79 | 61.08 | 63.37 | 64.78 | 67.07 |
Numerical data
The following are the details of the technical indicators and moving averages that were collected to generate this technical analysis:
| RSI (14): | 28.89 | |
| MACD (12,26,9): | -0.6400 | |
| Directional Movement: | -16.16 | |
| AROON (14): | -64.29 | |
| DEMA (21): | 60.15 | |
| Parabolic SAR (0,02-0,02-0,2): | 62.00 | |
| Elder Ray (13): | -1.93 | |
| Super Trend (3,10): | 61.67 | |
| Zig ZAG (10): | 57.80 | |
| VORTEX (21): | 0.7200 | |
| Stochastique (14,3,5): | 6.95 | |
| TEMA (21): | 59.09 | |
| Williams %R (14): | -98.25 | |
| Chande Momentum Oscillator (20): | -5.11 | |
| Repulse (5,40,3): | -3.0800 | |
| ROCnROLL: | 2 | |
| TRIX (15,9): | -0.0200 | |
| Courbe Coppock: | 7.93 |
| MA7: | 59.57 | |
| MA20: | 61.25 | |
| MA50: | 60.81 | |
| MA100: | 58.78 | |
| MAexp7: | 59.48 | |
| MAexp20: | 60.71 | |
| MAexp50: | 60.48 | |
| MAexp100: | 59.17 | |
| Price / MA7: | -2.97% | |
| Price / MA20: | -5.63% | |
| Price / MA50: | -4.95% | |
| Price / MA100: | -1.67% | |
| Price / MAexp7: | -2.82% | |
| Price / MAexp20: | -4.79% | |
| Price / MAexp50: | -4.43% | |
| Price / MAexp100: | -2.32% |
News
The latest news and videos published on BANCFIRST CORP. at the time of the analysis were as follows:
- BancFirst Corporation Reports Fourth Quarter Earnings
- BancFirst Corporation Reports Third Quarter Earnings
- BancFirst Corporation Reports Second Quarter Earnings
- BancFirst Corporation Reports First Quarter Earnings
- BancFirst Corporation Reports Fourth Quarter Earnings
About author

Online


Add a comment
Comments
0 comments on the analysis BANCFIRST CORP. - Daily