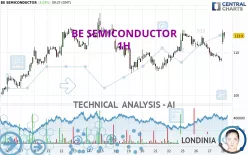
BE SEMICONDUCTOR - 1H - Technical analysis published on 11/28/2024 (GMT)
- 102
- 0
Click here for a new analysis!
- Timeframe : 1H
- - Analysis generated on
- Status : INVALID

Summary of the analysis

Additional analysis
Quotes
The BE SEMICONDUCTOR rating is 113.90 EUR. On the day, this instrument gained +5.03% and was traded between 111.90 EUR and 115.25 EUR over the period. The price is currently at +1.79% from its lowest and -1.17% from its highest.The Central Gaps scanner detects the formation of a bullish gap marking the strong presence of buyers against sellers at the opening. This formed a quotation gap.
Opening Gap UP
Type : Bullish
Timeframe : Openning
So that you have an overall view of the price change, here is a table showing the variations over several periods:
Near a new HIGH record (1 month)
Type : Bullish
Timeframe : Weekly
Technical
A technical analysis in 1H of this BE SEMICONDUCTOR chart shows a strongly bullish trend. The signals given by the moving averages are 85.71% bullish. This strong bullish trend is confirmed by the strong signals currently being given by short-term moving averages. The Central Indicators scanner detects bullish signals on moving averages that could impact this trend:
Bullish trend reversal : Moving Average 20
Type : Bullish
Timeframe : 1 hour
Bullish trend reversal : Moving Average 50
Type : Bullish
Timeframe : 1 hour
Bullish trend reversal : Moving Average 100
Type : Bullish
Timeframe : 1 hour
Bullish trend reversal : adaptative moving average 20
Type : Bullish
Timeframe : 1 hour
Bullish trend reversal : adaptative moving average 50
Type : Bullish
Timeframe : 1 hour
Bullish trend reversal : adaptative moving average 100
Type : Bullish
Timeframe : 1 hour
In fact, according to the parameters integrated into the Central Analyzer system, 13 technical indicators out of 18 analysed are currently bullish. Caution: the Central Indicators scanner currently detects an excess:
CCI indicator is overbought : over 100
Type : Neutral
Timeframe : 1 hour
Previous candle closed over Bollinger bands
Type : Neutral
Timeframe : 1 hour
Pivot points : price is over resistance 3
Type : Neutral
Timeframe : 1 hour
MACD indicator is back over 0
Type : Bullish
Timeframe : 1 hour
An analysis of the price chart with the Central Patterns scanner (detector of chart patterns and resistances and supports) shows several results that can have an impact on the price change:
Near horizontal resistance
Type : Bearish
Timeframe : 1 hour
Resistance of channel is broken
Type : Bullish
Timeframe : 1 hour
The Central Candlesticks scanner which studies Japanese candlesticks did not detect anything.
| S3 | S2 | S1 | Price | R1 | R2 | R3 | |
|---|---|---|---|---|---|---|---|
| ProTrendLines | 105.15 | 107.67 | 111.17 | 113.90 | 115.13 | 120.40 | 138.53 |
| Change (%) | -7.68% | -5.47% | -2.40% | - | +1.08% | +5.71% | +21.62% |
| Change | -8.75 | -6.23 | -2.73 | - | +1.23 | +6.50 | +24.63 |
| Level | Major | Major | Intermediate | - | Intermediate | Major | Intermediate |
Attention could also be paid to pivot points to set price objectives:
| Pivot points | S3 | S2 | S1 | PP | R1 | R2 | R3 |
|---|---|---|---|---|---|---|---|
| Standard | 104.00 | 105.95 | 107.20 | 109.15 | 110.40 | 112.35 | 113.60 |
| Camarilla | 107.57 | 107.86 | 108.16 | 108.45 | 108.74 | 109.04 | 109.33 |
| Woodie | 103.65 | 105.78 | 106.85 | 108.98 | 110.05 | 112.18 | 113.25 |
| Fibonacci | 105.95 | 107.17 | 107.93 | 109.15 | 110.37 | 111.13 | 112.35 |
| Pivot points | S3 | S2 | S1 | PP | R1 | R2 | R3 |
|---|---|---|---|---|---|---|---|
| Standard | 97.90 | 101.50 | 107.15 | 110.75 | 116.40 | 120.00 | 125.65 |
| Camarilla | 110.26 | 111.10 | 111.95 | 112.80 | 113.65 | 114.50 | 115.34 |
| Woodie | 98.93 | 102.01 | 108.18 | 111.26 | 117.43 | 120.51 | 126.68 |
| Fibonacci | 101.50 | 105.03 | 107.22 | 110.75 | 114.28 | 116.47 | 120.00 |
| Pivot points | S3 | S2 | S1 | PP | R1 | R2 | R3 |
|---|---|---|---|---|---|---|---|
| Standard | 70.93 | 83.37 | 90.66 | 103.10 | 110.39 | 122.83 | 130.12 |
| Camarilla | 92.51 | 94.32 | 96.13 | 97.94 | 99.75 | 101.56 | 103.37 |
| Woodie | 68.35 | 82.08 | 88.08 | 101.81 | 107.81 | 121.54 | 127.54 |
| Fibonacci | 83.37 | 90.91 | 95.57 | 103.10 | 110.64 | 115.30 | 122.83 |
Numerical data
The following is the status of the technical indicators and moving averages at the time of publication of this technical analysis:
| RSI (14): | 62.70 | |
| MACD (12,26,9): | 0.0500 | |
| Directional Movement: | 21.95 | |
| AROON (14): | 14.29 | |
| DEMA (21): | 110.88 | |
| Parabolic SAR (0,02-0,02-0,2): | 107.90 | |
| Elder Ray (13): | 3.06 | |
| Super Trend (3,10): | 109.27 | |
| Zig ZAG (10): | 114.00 | |
| VORTEX (21): | 0.9400 | |
| Stochastique (14,3,5): | 60.93 | |
| TEMA (21): | 110.79 | |
| Williams %R (14): | -17.01 | |
| Chande Momentum Oscillator (20): | 2.70 | |
| Repulse (5,40,3): | 1.0700 | |
| ROCnROLL: | 1 | |
| TRIX (15,9): | -0.0300 | |
| Courbe Coppock: | 2.25 |
| MA7: | 110.44 | |
| MA20: | 109.20 | |
| MA50: | 108.11 | |
| MA100: | 115.24 | |
| MAexp7: | 111.28 | |
| MAexp20: | 110.87 | |
| MAexp50: | 110.71 | |
| MAexp100: | 110.16 | |
| Price / MA7: | +3.13% | |
| Price / MA20: | +4.30% | |
| Price / MA50: | +5.36% | |
| Price / MA100: | -1.16% | |
| Price / MAexp7: | +2.35% | |
| Price / MAexp20: | +2.73% | |
| Price / MAexp50: | +2.88% | |
| Price / MAexp100: | +3.40% |
News
The latest news and videos published on BE SEMICONDUCTOR at the time of the analysis were as follows:
- Strong Q4-17 Results. Revenue and Net Income of € 153.2 Million and € 43.6 Million Up 64.6% and 161.1%, Respectively, vs. Q4-16. Orders of € 149.4 Million Up 63.5% vs. Q4-16
- Besi Posts Strong Q3-17 and YTD-17 Results
- Besi Posts Strong Q2-17 and H1-17 Results
- Besi Reports Q1-17 Revenue of € 110.2 Million and Net Income of € 24.3 Million
-
 BE Semiconductor Inds
About author
Online


Add a comment
Comments
0 comments on the analysis BE SEMICONDUCTOR - 1H