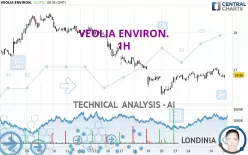
VEOLIA ENVIRON. - 1H - Technical analysis published on 12/31/2024 (GMT)
- 92
- 0
Click here for a new analysis!
- Timeframe : 1H
- - Analysis generated on
- Status : LEVEL MAINTAINED

Summary of the analysis

Additional analysis
Quotes
VEOLIA ENVIRON. rating 26.86 EUR. On the day, this instrument gained +0.08% and was traded between 26.77 EUR and 26.87 EUR over the period. The price is currently at +0.34% from its lowest and -0.04% from its highest.The Central Gaps scanner detects a bearish opening marking the presence of sellers ahead of buyers at the opening but not sufficiently marked to allow the price to register a quotation gap.
Bearish opening
Type : Bearish
Timeframe : Openning
Here is a more detailed summary of the historical variations registered by VEOLIA ENVIRON.:
Near a new LOW record (1 year)
Type : Bearish
Timeframe : Weekly
Near a new LOW record (1st january)
Type : Bearish
Timeframe : Weekly
Near a new LOW record (1 month)
Type : Bearish
Timeframe : Weekly
Technical
Technical analysis of this 1H chart of VEOLIA ENVIRON. indicates that the overall trend is bearish. 75.00% of the signals given by moving averages are bearish. This bearish trend is slowing down slightly given the slightly bearish signals given by short-term moving averages. An assessment of moving averages reveals several bearish and bullish signals:
Bullish trend reversal : Moving Average 50
Type : Bullish
Timeframe : 1 hour
Bearish price crossover with adaptative moving average 20
Type : Bearish
Timeframe : 1 hour
Technical indicators are slightly bearish. There is therefore considerable uncertainty about the continuation of the decline.
Other results related to technical indicators were also found by the Central Indicators scanner:
Price is back under the pivot point
Type : Bearish
Timeframe : Weekly
Momentum indicator is back under 0
Type : Bearish
Timeframe : 1 hour
Central Patterns, the market scanner focusing on chart patterns, resistances and supports found this result:
Near support of channel
Type : Bullish
Timeframe : 1 hour
The Central Candlesticks scanner currently notes the presence of this pattern in Japanese candlesticks that could mark the end of the short-term trend currently underway:
Doji
Type : Neutral
Timeframe : 1 hour
| S3 | S2 | S1 | Price | R1 | R2 | R3 | |
|---|---|---|---|---|---|---|---|
| ProTrendLines | 26.32 | 26.50 | 26.68 | 26.86 | 26.97 | 27.27 | 28.33 |
| Change (%) | -2.01% | -1.34% | -0.67% | - | +0.41% | +1.53% | +5.47% |
| Change | -0.54 | -0.36 | -0.18 | - | +0.11 | +0.41 | +1.47 |
| Level | Minor | Major | Intermediate | - | Intermediate | Minor | Intermediate |
To determine price objectives, it is also possible to use the pivot points. Here is the price position in relation to pivot points:
| Pivot points | S3 | S2 | S1 | PP | R1 | R2 | R3 |
|---|---|---|---|---|---|---|---|
| Standard | 26.47 | 26.63 | 26.74 | 26.90 | 27.01 | 27.17 | 27.28 |
| Camarilla | 26.77 | 26.79 | 26.82 | 26.84 | 26.87 | 26.89 | 26.91 |
| Woodie | 26.44 | 26.62 | 26.71 | 26.89 | 26.98 | 27.16 | 27.25 |
| Fibonacci | 26.63 | 26.74 | 26.80 | 26.90 | 27.01 | 27.07 | 27.17 |
| Pivot points | S3 | S2 | S1 | PP | R1 | R2 | R3 |
|---|---|---|---|---|---|---|---|
| Standard | 26.42 | 26.53 | 26.74 | 26.85 | 27.06 | 27.17 | 27.38 |
| Camarilla | 26.85 | 26.88 | 26.91 | 26.94 | 26.97 | 27.00 | 27.03 |
| Woodie | 26.46 | 26.56 | 26.78 | 26.88 | 27.10 | 27.20 | 27.42 |
| Fibonacci | 26.53 | 26.66 | 26.73 | 26.85 | 26.98 | 27.05 | 27.17 |
| Pivot points | S3 | S2 | S1 | PP | R1 | R2 | R3 |
|---|---|---|---|---|---|---|---|
| Standard | 22.76 | 24.65 | 26.11 | 28.00 | 29.46 | 31.35 | 32.81 |
| Camarilla | 26.65 | 26.96 | 27.26 | 27.57 | 27.88 | 28.18 | 28.49 |
| Woodie | 22.55 | 24.54 | 25.90 | 27.89 | 29.25 | 31.24 | 32.60 |
| Fibonacci | 24.65 | 25.93 | 26.72 | 28.00 | 29.28 | 30.07 | 31.35 |
Numerical data
The following is the status of the technical indicators and moving averages at the time of publication of this technical analysis:
| RSI (14): | 45.60 | |
| MACD (12,26,9): | 0.0100 | |
| Directional Movement: | -9.52 | |
| AROON (14): | 57.15 | |
| DEMA (21): | 26.89 | |
| Parabolic SAR (0,02-0,02-0,2): | 27.06 | |
| Elder Ray (13): | -0.08 | |
| Super Trend (3,10): | 26.73 | |
| Zig ZAG (10): | 26.82 | |
| VORTEX (21): | 0.9000 | |
| Stochastique (14,3,5): | 22.58 | |
| TEMA (21): | 26.91 | |
| Williams %R (14): | -80.65 | |
| Chande Momentum Oscillator (20): | -0.10 | |
| Repulse (5,40,3): | -0.0500 | |
| ROCnROLL: | 2 | |
| TRIX (15,9): | 0.0200 | |
| Courbe Coppock: | 0.17 |
| MA7: | 26.82 | |
| MA20: | 27.42 | |
| MA50: | 28.18 | |
| MA100: | 28.84 | |
| MAexp7: | 26.87 | |
| MAexp20: | 26.88 | |
| MAexp50: | 26.92 | |
| MAexp100: | 27.11 | |
| Price / MA7: | +0.15% | |
| Price / MA20: | -2.04% | |
| Price / MA50: | -4.68% | |
| Price / MA100: | -6.87% | |
| Price / MAexp7: | +0.04% | |
| Price / MAexp20: | -0% | |
| Price / MAexp50: | -0.15% | |
| Price / MAexp100: | -0.85% |
News
The latest news and videos published on VEOLIA ENVIRON. at the time of the analysis were as follows:
- Case Study: Addressing PFAS in Drinking Water in Affected Communities in the State of New Jersey
- Working With Our Clients To Reduce Their Environmental Impact
- Anaerobic Digestion in Canada: One More Step to Solving the Climate Crisis
- Veolia Joins WFX Water Roundtable to Improve Water Infrastructure and Bring Water Equity to Underserved American Communities
- Veolia joins WFX Water Roundtable to improve water infrastructure and bring water equity to underserved American communities
About author
Online


Add a comment
Comments
0 comments on the analysis VEOLIA ENVIRON. - 1H