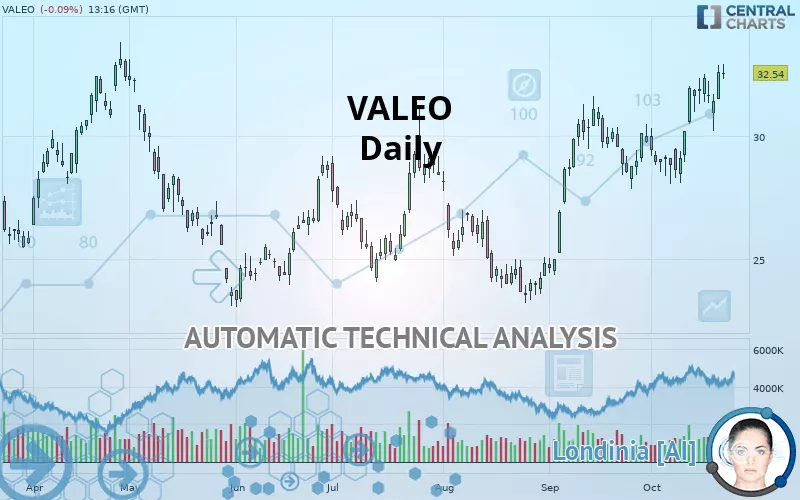
VALEO - Daily - Technical analysis published on 10/22/2019 (GMT)
- 408
- 0
- Who voted?
Click here for a new analysis!
- Timeframe : Daily
- - Analysis generated on
- Status : TARGET REACHED
Summary of the analysis

Additional analysis
Quotes
VALEO rating 32.54 EUR. The price registered a decrease of -0.09% on the session and was between 32.32 EUR and 32.89 EUR. This implies that the price is at +0.68% from its lowest and at -1.06% from its highest.A bearish opening was detected by the Central Gaps scanner. Sellers are trying to impose a bearish trend in the very short term.
Bearish opening
Type : Bearish
Timeframe : Openning
Here is a more detailed summary of the historical variations registered by VALEO:
New HIGH record (1 year)
Type : Bullish
Timeframe : Weekly
New HIGH record (1st january)
Type : Bullish
Timeframe : Weekly
New HIGH record (1 month)
Type : Bullish
Timeframe : Weekly
Technical
Technical analysis of this Daily chart of VALEO indicates that the overall trend is strongly bullish. 92.86% of the signals given by moving averages are bullish. This strongly bullish trend is supported by the strong bullish signals given by short-term moving averages. There is no crossing of moving average by the price or crossing of moving averages between themselves.
In fact, 15 technical indicators on 18 studied are currently positioned bullish. Caution: the Central Indicators scanner currently detects an excess:
CCI indicator is overbought : over 100
Type : Neutral
Timeframe : Daily
Williams %R indicator is overbought : over -20
Type : Neutral
Timeframe : Daily
Price is back over the pivot point
Type : Bullish
Timeframe : Daily
Central Patterns, the market scanner focusing on chart patterns, resistances and supports found this result:
Near horizontal resistance
Type : Bearish
Timeframe : Daily
The Central Candlesticks scanner which studies Japanese candlesticks did not detect anything.
| S3 | S2 | S1 | Price | R1 | R2 | R3 | |
|---|---|---|---|---|---|---|---|
| ProTrendLines | 25.48 | 28.59 | 31.07 | 32.54 | 33.11 | 34.98 | 38.44 |
| Change (%) | -21.70% | -12.14% | -4.52% | - | +1.75% | +7.50% | +18.13% |
| Change | -7.06 | -3.95 | -1.47 | - | +0.57 | +2.44 | +5.90 |
| Level | Minor | Intermediate | Major | - | Intermediate | Minor | Minor |
Pivot points can also be used to set your price objectives. Here is the price situation in relation to pivot points:
| Pivot points | S3 | S2 | S1 | PP | R1 | R2 | R3 |
|---|---|---|---|---|---|---|---|
| Standard | 30.37 | 30.94 | 31.75 | 32.32 | 33.13 | 33.70 | 34.51 |
| Camarilla | 32.19 | 32.32 | 32.44 | 32.57 | 32.70 | 32.82 | 32.95 |
| Woodie | 30.50 | 31.00 | 31.88 | 32.38 | 33.26 | 33.76 | 34.64 |
| Fibonacci | 30.94 | 31.46 | 31.79 | 32.32 | 32.84 | 33.17 | 33.70 |
| Pivot points | S3 | S2 | S1 | PP | R1 | R2 | R3 |
|---|---|---|---|---|---|---|---|
| Standard | 27.90 | 29.05 | 30.22 | 31.37 | 32.54 | 33.69 | 34.86 |
| Camarilla | 30.76 | 30.98 | 31.19 | 31.40 | 31.61 | 31.83 | 32.04 |
| Woodie | 27.92 | 29.06 | 30.24 | 31.38 | 32.56 | 33.70 | 34.88 |
| Fibonacci | 29.05 | 29.93 | 30.48 | 31.37 | 32.25 | 32.80 | 33.69 |
| Pivot points | S3 | S2 | S1 | PP | R1 | R2 | R3 |
|---|---|---|---|---|---|---|---|
| Standard | 18.24 | 21.30 | 25.52 | 28.58 | 32.80 | 35.86 | 40.08 |
| Camarilla | 27.75 | 28.42 | 29.08 | 29.75 | 30.42 | 31.09 | 31.75 |
| Woodie | 18.83 | 21.59 | 26.11 | 28.87 | 33.39 | 36.15 | 40.67 |
| Fibonacci | 21.30 | 24.08 | 25.80 | 28.58 | 31.36 | 33.08 | 35.86 |
Numerical data
The following is the status of technical indicators and moving averages registered at the time this technical analysis was created:
| RSI (14): | 66.29 | |
| MACD (12,26,9): | 1.0200 | |
| Directional Movement: | 13.75 | |
| AROON (14): | 78.57 | |
| DEMA (21): | 31.98 | |
| Parabolic SAR (0,02-0,02-0,2): | 29.72 | |
| Elder Ray (13): | 1.39 | |
| Super Trend (3,10): | 29.29 | |
| Zig ZAG (10): | 32.48 | |
| VORTEX (21): | 1.1500 | |
| Stochastique (14,3,5): | 87.02 | |
| TEMA (21): | 32.32 | |
| Williams %R (14): | -7.64 | |
| Chande Momentum Oscillator (20): | 3.40 | |
| Repulse (5,40,3): | 4.3700 | |
| ROCnROLL: | 1 | |
| TRIX (15,9): | 0.4200 | |
| Courbe Coppock: | 18.55 |
| MA7: | 31.98 | |
| MA20: | 30.33 | |
| MA50: | 28.32 | |
| MA100: | 27.38 | |
| MAexp7: | 31.84 | |
| MAexp20: | 30.69 | |
| MAexp50: | 29.18 | |
| MAexp100: | 28.08 | |
| Price / MA7: | +1.75% | |
| Price / MA20: | +7.29% | |
| Price / MA50: | +14.90% | |
| Price / MA100: | +18.85% | |
| Price / MAexp7: | +2.20% | |
| Price / MAexp20: | +6.03% | |
| Price / MAexp50: | +11.51% | |
| Price / MAexp100: | +15.88% |
News
The latest news and videos published on VALEO at the time of the analysis were as follows:
- Campbell Completes Sale of European Chips Business to Valeo Foods
- Dana and Valeo Collaborate to Supply Complete 48-Volt Electric Vehicle Systems
- Campbell and Valeo Foods Sign Agreement for Intended Sale of Campbell’s European Chips Business
- Valeo announces an employee share offering
- Valeo Pharma Announces Short Form Prospectus Unit Offering and Refiling of Its Condensed Consolidated Interim Financial Statements and Related MD&A
About author

Online


Add a comment
Comments
0 comments on the analysis VALEO - Daily