| Open: | - |
| Change: | - |
| Volume: | - |
| Low: | - |
| High: | - |
| High / Low range: | - |
| Type: | Stocks |
| Ticker: | UMC |
| ISIN: | TW0002303005 |
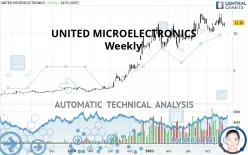
UNITED MICROELECTRONICS - Weekly - Technical analysis published on 12/21/2021 (GMT)
- 283
- 0
- 12/21/2021 - 19:09
Click here for a new analysis!
- Timeframe : Weekly
- - Analysis generated on 12/21/2021 - 19:09
- Status : INVALID

Summary of the analysis

Additional analysis
Quotes
The UNITED MICROELECTRONICS rating is 11.39 USD. The price is up +2.80% over 5 days and has been traded over the last 5 days between 10.86 USD and 11.18 USD. This implies that the 5 day price is +4.85% from its lowest point and +1.88% from its highest point.A bullish gap was detected at the opening by the Central Gaps scanner. There are a lot of buyers and they have the upper hand in the very short term.
Opening Gap UP
Type : Bullish
Timeframe : Openning
A study of price movements over other periods shows the following variations:
Near a new LOW record (1 month)
Type : Bearish
Timeframe : Weekly
Technical
Technical analysis of UNITED MICROELECTRONICS in Weekly shows a strongly overall bullish trend. 92.86% of the signals given by moving averages are bullish. This strongly bullish trend is supported by the strong bullish signals given by short-term moving averages. An assessment of moving averages reveals a bearish signal that could impact this trend:
Bearish price crossover with Moving Average 20
Type : Bearish
Timeframe : Weekly
In fact, of the 18 technical indicators analysed by Central Analyzer, 7 are bullish, 6 are neutral and 5 are bearish. The Central Indicators scanner found this result concerning these indicators:
Price is back over the pivot point
Type : Bullish
Timeframe : Weekly
The Central Patterns scanner, which studies chart patterns, resistances and supports, has identified these signals:
Near horizontal support
Type : Bullish
Timeframe : Weekly
Near support of triangle
Type : Bullish
Timeframe : Weekly
The Central Candlesticks scanner which studies Japanese candlesticks did not detect anything.
| S3 | S2 | S1 | Price | R1 | |
|---|---|---|---|---|---|
| ProTrendLines | 4.47 | 9.16 | 11.19 | 11.39 | 12.50 |
| Change (%) | -60.76% | -19.58% | -1.76% | - | +9.75% |
| Change | -6.92 | -2.23 | -0.20 | - | +1.11 |
| Level | Intermediate | Major | Major | - | Major |
To determine price objectives, it is also possible to use the pivot points. Here is the price position in relation to pivot points:
| Pivot points | S3 | S2 | S1 | PP | R1 | R2 | R3 |
|---|---|---|---|---|---|---|---|
| Standard | 10.63 | 10.74 | 10.84 | 10.95 | 11.05 | 11.16 | 11.26 |
| Camarilla | 10.87 | 10.89 | 10.91 | 10.93 | 10.95 | 10.97 | 10.99 |
| Woodie | 10.62 | 10.74 | 10.83 | 10.95 | 11.04 | 11.16 | 11.25 |
| Fibonacci | 10.74 | 10.82 | 10.87 | 10.95 | 11.03 | 11.08 | 11.16 |
| Pivot points | S3 | S2 | S1 | PP | R1 | R2 | R3 |
|---|---|---|---|---|---|---|---|
| Standard | 10.19 | 10.52 | 10.80 | 11.13 | 11.41 | 11.74 | 12.02 |
| Camarilla | 10.90 | 10.96 | 11.01 | 11.07 | 11.13 | 11.18 | 11.24 |
| Woodie | 10.16 | 10.51 | 10.77 | 11.12 | 11.38 | 11.73 | 11.99 |
| Fibonacci | 10.52 | 10.76 | 10.90 | 11.13 | 11.37 | 11.51 | 11.74 |
| Pivot points | S3 | S2 | S1 | PP | R1 | R2 | R3 |
|---|---|---|---|---|---|---|---|
| Standard | 8.80 | 9.49 | 10.56 | 11.25 | 12.32 | 13.01 | 14.08 |
| Camarilla | 11.15 | 11.31 | 11.47 | 11.63 | 11.79 | 11.95 | 12.11 |
| Woodie | 8.99 | 9.59 | 10.75 | 11.35 | 12.51 | 13.11 | 14.27 |
| Fibonacci | 9.49 | 10.16 | 10.58 | 11.25 | 11.92 | 12.34 | 13.01 |
Numerical data
The following is the status of the technical indicators and moving averages at the time of publication of this technical analysis:
| RSI (14): | 54.80 | |
| MACD (12,26,9): | 0.4300 | |
| Directional Movement: | 14.43 | |
| AROON (14): | 50.00 | |
| DEMA (21): | 11.61 | |
| Parabolic SAR (0,02-0,02-0,2): | 12.68 | |
| Elder Ray (13): | -0.07 | |
| Super Trend (3,10): | 9.36 | |
| Zig ZAG (10): | 11.34 | |
| VORTEX (21): | 1.0600 | |
| Stochastique (14,3,5): | 45.02 | |
| TEMA (21): | 11.41 | |
| Williams %R (14): | -51.53 | |
| Chande Momentum Oscillator (20): | 0.04 | |
| Repulse (5,40,3): | -1.0100 | |
| ROCnROLL: | 1 | |
| TRIX (15,9): | 0.7000 | |
| Courbe Coppock: | 1.32 |
| MA7: | 11.13 | |
| MA20: | 11.51 | |
| MA50: | 11.09 | |
| MA100: | 11.17 | |
| MAexp7: | 11.29 | |
| MAexp20: | 10.97 | |
| MAexp50: | 9.74 | |
| MAexp100: | 7.83 | |
| Price / MA7: | +2.34% | |
| Price / MA20: | -1.04% | |
| Price / MA50: | +2.71% | |
| Price / MA100: | +1.97% | |
| Price / MAexp7: | +0.89% | |
| Price / MAexp20: | +3.83% | |
| Price / MAexp50: | +16.94% | |
| Price / MAexp100: | +45.47% |
News
The latest news and videos published on UNITED MICROELECTRONICS at the time of the analysis were as follows:
- 12/06/2021 - 09:00 UMC Reports Sales for November 2021
- 11/25/2021 - 23:51 Micron and UMC Announce Global Settlement
- 11/13/2021 - 05:22 UMC Leads Semiconductor Foundries in the 2021 Dow Jones Sustainability Indices (DJSI)
- 11/04/2021 - 09:00 UMC Reports Sales for October 2021
- 10/27/2021 - 08:35 UMC Reports Third Quarter 2021 Results
About author

Online


Add a comment
Comments
0 comments on the analysis UNITED MICROELECTRONICS - Weekly