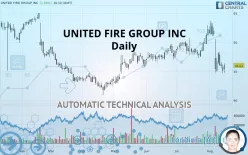
UNITED FIRE GROUP INC - Daily - Technical analysis published on 08/15/2019 (GMT)
- 211
- 0
- Who voted?
Click here for a new analysis!
- Timeframe : Daily
- - Analysis generated on
- Status : LEVEL MAINTAINED

Summary of the analysis

Additional analysis
Quotes
The UNITED FIRE GROUP INC rating is 46.01 USD. The price registered an increase of +1.95% on the session and was between 44.73 USD and 46.31 USD. This implies that the price is at +2.86% from its lowest and at -0.65% from its highest.The Central Gaps scanner detects a bullish opening marking the presence of buyers ahead of sellers at the opening but not sufficiently marked to allow the price to register a quotation gap.
Bullish opening
Type : Bullish
Timeframe : Openning
A study of price movements over other periods shows the following variations:
Near a new LOW record (1 month)
Type : Bearish
Timeframe : Weekly
Technical
Technical analysis of UNITED FIRE GROUP INC in Daily shows an overall bearish trend. 64.29% of the signals given by moving averages are bearish. This bearish trend is supported by the strong bearish signals given by short-term moving averages. The Central Indicators market scanner is currently detecting a bearish signal that could impact this trend:
Moving Average bearish crossovers : AMA50 & AMA100
Type : Bearish
Timeframe : Daily
An assessment of technical indicators does not currently provide any relevant information on the direction of future price movements.
Caution: the Central Indicators scanner currently detects an excess:
CCI indicator is oversold : under -100
Type : Neutral
Timeframe : Daily
Williams %R indicator is oversold : under -80
Type : Neutral
Timeframe : Daily
Ichimoku : price is under the cloud
Type : Bearish
Timeframe : Daily
Price is back under the pivot point
Type : Bearish
Timeframe : Daily
Price is back under the pivot point
Type : Bearish
Timeframe : Weekly
The analysis of the price chart with Central Patterns scanners does not return any result.
No result was found by the Central Candlesticks scanner on Japanese candlesticks.
| S3 | S2 | S1 | Price | R1 | R2 | R3 | |
|---|---|---|---|---|---|---|---|
| ProTrendLines | 39.42 | 41.79 | 44.29 | 46.01 | 47.04 | 50.43 | 53.27 |
| Change (%) | -14.32% | -9.17% | -3.74% | - | +2.24% | +9.61% | +15.78% |
| Change | -6.59 | -4.22 | -1.72 | - | +1.03 | +4.42 | +7.26 |
| Level | Major | Intermediate | Intermediate | - | Major | Major | Major |
Attention could also be paid to pivot points to set price objectives:
| Pivot points | S3 | S2 | S1 | PP | R1 | R2 | R3 |
|---|---|---|---|---|---|---|---|
| Standard | 42.92 | 43.76 | 44.45 | 45.29 | 45.98 | 46.82 | 47.51 |
| Camarilla | 44.71 | 44.85 | 44.99 | 45.13 | 45.27 | 45.41 | 45.55 |
| Woodie | 42.84 | 43.72 | 44.37 | 45.25 | 45.90 | 46.78 | 47.43 |
| Fibonacci | 43.76 | 44.35 | 44.71 | 45.29 | 45.88 | 46.24 | 46.82 |
| Pivot points | S3 | S2 | S1 | PP | R1 | R2 | R3 |
|---|---|---|---|---|---|---|---|
| Standard | 35.62 | 40.20 | 44.11 | 48.68 | 52.59 | 57.17 | 61.08 |
| Camarilla | 45.69 | 46.46 | 47.24 | 48.02 | 48.80 | 49.58 | 50.35 |
| Woodie | 35.29 | 40.03 | 43.78 | 48.52 | 52.26 | 57.00 | 60.75 |
| Fibonacci | 40.20 | 43.44 | 45.44 | 48.68 | 51.92 | 53.93 | 57.17 |
| Pivot points | S3 | S2 | S1 | PP | R1 | R2 | R3 |
|---|---|---|---|---|---|---|---|
| Standard | 43.04 | 45.16 | 48.72 | 50.84 | 54.40 | 56.52 | 60.08 |
| Camarilla | 50.71 | 51.23 | 51.75 | 52.27 | 52.79 | 53.31 | 53.83 |
| Woodie | 43.75 | 45.52 | 49.43 | 51.20 | 55.11 | 56.88 | 60.79 |
| Fibonacci | 45.16 | 47.33 | 48.67 | 50.84 | 53.01 | 54.35 | 56.52 |
Numerical data
The following are the details of the technical indicators and moving averages that were collected to generate this technical analysis:
| RSI (14): | 41.26 | |
| MACD (12,26,9): | -0.7500 | |
| Directional Movement: | -10.41 | |
| AROON (14): | -57.15 | |
| DEMA (21): | 47.48 | |
| Parabolic SAR (0,02-0,02-0,2): | 52.50 | |
| Elder Ray (13): | -2.26 | |
| Super Trend (3,10): | 51.05 | |
| Zig ZAG (10): | 45.89 | |
| VORTEX (21): | 0.9000 | |
| Stochastique (14,3,5): | 12.29 | |
| TEMA (21): | 46.49 | |
| Williams %R (14): | -84.23 | |
| Chande Momentum Oscillator (20): | -5.17 | |
| Repulse (5,40,3): | 0.8200 | |
| ROCnROLL: | 2 | |
| TRIX (15,9): | -0.0200 | |
| Courbe Coppock: | 9.98 |
| MA7: | 46.19 | |
| MA20: | 48.81 | |
| MA50: | 48.56 | |
| MA100: | 46.67 | |
| MAexp7: | 46.75 | |
| MAexp20: | 48.14 | |
| MAexp50: | 48.22 | |
| MAexp100: | 48.01 | |
| Price / MA7: | -0.39% | |
| Price / MA20: | -5.74% | |
| Price / MA50: | -5.25% | |
| Price / MA100: | -1.41% | |
| Price / MAexp7: | -1.58% | |
| Price / MAexp20: | -4.42% | |
| Price / MAexp50: | -4.58% | |
| Price / MAexp100: | -4.17% |
News
Don"t forget to follow the news on UNITED FIRE GROUP INC. At the time of publication of this analysis, the latest news was as follows:
- United Fire Group, Inc. to Host Earnings Call
- United Fire Group, Inc. to Host Earnings Call
- Investor Network: United Fire Group, Inc. to Host Earnings Call
- Investor Network: United Fire Group, Inc. to Host Earnings Call
-
 United Fire Group
About author

Online


Add a comment
Comments
0 comments on the analysis UNITED FIRE GROUP INC - Daily