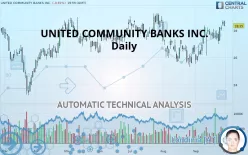
UNITED COMMUNITY BANKS INC. - Daily - Technical analysis published on 10/01/2019 (GMT)
- 141
- 0
- Who voted?
Click here for a new analysis!
- Timeframe : Daily
- - Analysis generated on
- Status : TARGET REACHED

Summary of the analysis

Additional analysis
Quotes
The UNITED COMMUNITY BANKS INC. price is 28.35 USD. On the day, this instrument lost -0.91% with the lowest point at 28.29 USD and the highest point at 28.71 USD. The deviation from the price is +0.21% for the low point and -1.25% for the high point.So that you have an overall view of the price change, here is a table showing the variations over several periods:
Near a new HIGH record (1 year)
Type : Bullish
Timeframe : Weekly
Near a new HIGH record (1st january)
Type : Bullish
Timeframe : Weekly
Near a new HIGH record (1 month)
Type : Bullish
Timeframe : Weekly
Technical
Technical analysis of UNITED COMMUNITY BANKS INC. in Daily shows a strongly overall bullish trend. The signals given by the moving averages are 89.29% bullish. This strong bullish trend is confirmed by the strong signals currently being given by short-term moving averages. The Central Indicators scanner detects a bullish signal on moving averages that could impact this trend:
Bullish trend reversal : Moving Average 100
Type : Bullish
Timeframe : Daily
The technical indicators are bullish. There is still some doubt about the price increase.
Caution: the Central Indicators scanner currently detects an excess:
CCI indicator is overbought : over 100
Type : Neutral
Timeframe : Daily
Williams %R indicator is overbought : over -20
Type : Neutral
Timeframe : Daily
Pivot points : price is under support 1
Type : Neutral
Timeframe : Daily
Price is back over the pivot point
Type : Bullish
Timeframe : Daily
Price is back over the pivot point
Type : Bullish
Timeframe : Weekly
The Central Patterns scanner, which studies chart patterns, resistances and supports, has identified these signals:
Near resistance of channel
Type : Bearish
Timeframe : Daily
Near resistance of triangle
Type : Bearish
Timeframe : Daily
The Central Candlesticks scanner, specialised in Japanese candlesticks, did not identify any signals.
| S3 | S2 | S1 | Price | R1 | R2 | R3 | |
|---|---|---|---|---|---|---|---|
| ProTrendLines | 23.39 | 25.63 | 26.51 | 28.35 | 28.69 | 29.74 | 32.21 |
| Change (%) | -17.50% | -9.59% | -6.49% | - | +1.20% | +4.90% | +13.62% |
| Change | -4.96 | -2.72 | -1.84 | - | +0.34 | +1.39 | +3.86 |
| Level | Major | Major | Intermediate | - | Major | Major | Minor |
Pivot points can also be used to set your price objectives. Here is the price situation in relation to pivot points:
| Pivot points | S3 | S2 | S1 | PP | R1 | R2 | R3 |
|---|---|---|---|---|---|---|---|
| Standard | 28.07 | 28.22 | 28.42 | 28.57 | 28.77 | 28.92 | 29.12 |
| Camarilla | 28.52 | 28.55 | 28.58 | 28.62 | 28.65 | 28.68 | 28.71 |
| Woodie | 28.09 | 28.23 | 28.44 | 28.58 | 28.79 | 28.93 | 29.14 |
| Fibonacci | 28.22 | 28.35 | 28.44 | 28.57 | 28.70 | 28.79 | 28.92 |
| Pivot points | S3 | S2 | S1 | PP | R1 | R2 | R3 |
|---|---|---|---|---|---|---|---|
| Standard | 25.76 | 26.37 | 27.49 | 28.11 | 29.23 | 29.84 | 30.96 |
| Camarilla | 28.14 | 28.30 | 28.46 | 28.62 | 28.77 | 28.93 | 29.09 |
| Woodie | 26.01 | 26.50 | 27.75 | 28.23 | 29.48 | 29.97 | 31.22 |
| Fibonacci | 26.37 | 27.03 | 27.44 | 28.11 | 28.77 | 29.18 | 29.84 |
| Pivot points | S3 | S2 | S1 | PP | R1 | R2 | R3 |
|---|---|---|---|---|---|---|---|
| Standard | 21.40 | 23.34 | 24.88 | 26.82 | 28.36 | 30.30 | 31.84 |
| Camarilla | 25.45 | 25.77 | 26.09 | 26.41 | 26.73 | 27.05 | 27.37 |
| Woodie | 21.19 | 23.24 | 24.67 | 26.72 | 28.15 | 30.20 | 31.63 |
| Fibonacci | 23.34 | 24.67 | 25.49 | 26.82 | 28.15 | 28.97 | 30.30 |
Numerical data
The following is the status of the technical indicators and moving averages at the time of publication of this technical analysis:
| RSI (14): | 58.49 | |
| MACD (12,26,9): | 0.3700 | |
| Directional Movement: | 6.31 | |
| AROON (14): | 78.57 | |
| DEMA (21): | 28.05 | |
| Parabolic SAR (0,02-0,02-0,2): | 27.08 | |
| Elder Ray (13): | 0.65 | |
| Super Trend (3,10): | 26.44 | |
| Zig ZAG (10): | 28.35 | |
| VORTEX (21): | 1.0600 | |
| Stochastique (14,3,5): | 91.34 | |
| TEMA (21): | 28.40 | |
| Williams %R (14): | -14.31 | |
| Chande Momentum Oscillator (20): | 0.82 | |
| Repulse (5,40,3): | 0.0200 | |
| ROCnROLL: | 1 | |
| TRIX (15,9): | 0.1400 | |
| Courbe Coppock: | 8.41 |
| MA7: | 28.00 | |
| MA20: | 27.47 | |
| MA50: | 27.24 | |
| MA100: | 27.43 | |
| MAexp7: | 28.11 | |
| MAexp20: | 27.63 | |
| MAexp50: | 27.37 | |
| MAexp100: | 27.25 | |
| Price / MA7: | +1.25% | |
| Price / MA20: | +3.20% | |
| Price / MA50: | +4.07% | |
| Price / MA100: | +3.35% | |
| Price / MAexp7: | +0.85% | |
| Price / MAexp20: | +2.61% | |
| Price / MAexp50: | +3.58% | |
| Price / MAexp100: | +4.04% |
News
Don"t forget to follow the news on UNITED COMMUNITY BANKS INC.. At the time of publication of this analysis, the latest news was as follows:
- Investor Network: United Community Banks, Inc. to Host Earnings Call
- United Community Banks, Inc. Announces Fourth Quarter Earnings
- United Community Banks, Inc. Announces Date for Fourth Quarter and Full Year 2016 Earnings Release and Conference Call
- United Community Banks, Inc. Announces Chief Financial Officer’s Retirement in 2017
- United Community Banks, Inc. to Participate in the 2016 Sandler O’Neill + Partners, L.P. East Coast Financial Services Conference
About author

Online


Add a comment
Comments
0 comments on the analysis UNITED COMMUNITY BANKS INC. - Daily