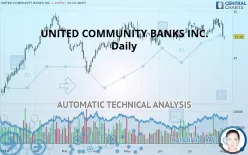
UNITED COMMUNITY BANKS INC. - Daily - Technical analysis published on 08/02/2019 (GMT)
- 238
- 0
- Who voted?
Click here for a new analysis!
- Timeframe : Daily
- - Analysis generated on
- Status : TARGET REACHED

Summary of the analysis

Additional analysis
Quotes
The UNITED COMMUNITY BANKS INC. price is 27.25 USD. The price registered a decrease of -0.07% on the session with the lowest point at 26.93 USD and the highest point at 27.28 USD. The deviation from the price is +1.19% for the low point and -0.11% for the high point.The Central Gaps scanner detects a bullish opening marking the presence of sellers ahead of buyers at the opening but not sufficiently marked to allow the price to register a quotation gap.
Bearish opening
Type : Bearish
Timeframe : Openning
A study of price movements over other periods shows the following variations:
Technical
Technical analysis of this Daily chart of UNITED COMMUNITY BANKS INC. indicates that the overall trend is slightly bearish. 57.14% of the signals given by moving averages are bearish. The overall trend could accelerate as a result of the strong bearish signals from short-term moving averages. An assessment of moving averages reveals several bearish signals that could impact this trend:
Bearish trend reversal : Moving Average 20
Type : Bearish
Timeframe : Daily
Bearish trend reversal : Moving Average 50
Type : Bearish
Timeframe : Daily
Bearish trend reversal : adaptative moving average 20
Type : Bearish
Timeframe : Daily
Bearish trend reversal : adaptative moving average 50
Type : Bearish
Timeframe : Daily
Bearish trend reversal : adaptative moving average 100
Type : Bearish
Timeframe : Daily
Bearish price crossover with Moving Average 20
Type : Bearish
Timeframe : Daily
Bearish price crossover with Moving Average 50
Type : Bearish
Timeframe : Daily
Bearish price crossover with adaptative moving average 20
Type : Bearish
Timeframe : Daily
In fact, according to the parameters integrated into the Central Analyzer system, only 9 technical indicators out of 18 analysed are currently bearish. Caution: the Central Indicators scanner currently detects an excess:
Williams %R indicator is oversold : under -80
Type : Neutral
Timeframe : Daily
Pivot points : price is under support 1
Type : Neutral
Timeframe : Weekly
RSI indicator is back under 50
Type : Bearish
Timeframe : Daily
MACD crosses DOWN its Moving Average
Type : Bearish
Timeframe : Daily
Parabolic SAR indicator bearish reversal
Type : Bearish
Timeframe : Daily
Price is back over the pivot point
Type : Bullish
Timeframe : Weekly
Price is back under the pivot point
Type : Bearish
Timeframe : Daily
Momentum indicator is back under 0
Type : Bearish
Timeframe : Daily
Williams %R indicator is back under -50
Type : Bearish
Timeframe : Daily
No signals are given by Central Patterns, a market scanner specialised in chart patterns, resistances and supports.
For a small setback in the very short term, the Central Candlesticks scanner currently notes the presence of this bearish pattern in Japanese candlesticks:
Black evening star
Type : Bearish
Timeframe : Daily
| S3 | S2 | S1 | Price | R1 | R2 | R3 | |
|---|---|---|---|---|---|---|---|
| ProTrendLines | 23.39 | 25.09 | 26.52 | 27.25 | 27.51 | 28.68 | 29.74 |
| Change (%) | -14.17% | -7.93% | -2.68% | - | +0.95% | +5.25% | +9.14% |
| Change | -3.86 | -2.16 | -0.73 | - | +0.26 | +1.43 | +2.49 |
| Level | Intermediate | Minor | Major | - | Minor | Major | Major |
Attention could also be paid to pivot points to set price objectives:
| Pivot points | S3 | S2 | S1 | PP | R1 | R2 | R3 |
|---|---|---|---|---|---|---|---|
| Standard | 25.10 | 26.14 | 26.70 | 27.74 | 28.30 | 29.34 | 29.90 |
| Camarilla | 26.83 | 26.98 | 27.12 | 27.27 | 27.42 | 27.56 | 27.71 |
| Woodie | 24.87 | 26.02 | 26.47 | 27.62 | 28.07 | 29.22 | 29.67 |
| Fibonacci | 26.14 | 26.75 | 27.13 | 27.74 | 28.35 | 28.73 | 29.34 |
| Pivot points | S3 | S2 | S1 | PP | R1 | R2 | R3 |
|---|---|---|---|---|---|---|---|
| Standard | 26.34 | 26.95 | 28.06 | 28.67 | 29.78 | 30.39 | 31.50 |
| Camarilla | 28.70 | 28.86 | 29.01 | 29.17 | 29.33 | 29.49 | 29.64 |
| Woodie | 26.59 | 27.08 | 28.31 | 28.80 | 30.03 | 30.52 | 31.75 |
| Fibonacci | 26.95 | 27.61 | 28.01 | 28.67 | 29.33 | 29.73 | 30.39 |
| Pivot points | S3 | S2 | S1 | PP | R1 | R2 | R3 |
|---|---|---|---|---|---|---|---|
| Standard | 25.56 | 26.42 | 27.56 | 28.42 | 29.56 | 30.42 | 31.56 |
| Camarilla | 28.15 | 28.33 | 28.52 | 28.70 | 28.88 | 29.07 | 29.25 |
| Woodie | 25.70 | 26.49 | 27.70 | 28.49 | 29.70 | 30.49 | 31.70 |
| Fibonacci | 26.42 | 27.18 | 27.66 | 28.42 | 29.18 | 29.66 | 30.42 |
Numerical data
The following is the status of technical indicators and moving averages registered at the time this technical analysis was created:
| RSI (14): | 40.49 | |
| MACD (12,26,9): | 0.0300 | |
| Directional Movement: | -5.66 | |
| AROON (14): | -35.71 | |
| DEMA (21): | 28.19 | |
| Parabolic SAR (0,02-0,02-0,2): | 29.24 | |
| Elder Ray (13): | -0.95 | |
| Super Trend (3,10): | 27.02 | |
| Zig ZAG (10): | 27.07 | |
| VORTEX (21): | 0.8900 | |
| Stochastique (14,3,5): | 25.68 | |
| TEMA (21): | 28.04 | |
| Williams %R (14): | -99.14 | |
| Chande Momentum Oscillator (20): | -0.54 | |
| Repulse (5,40,3): | -5.6800 | |
| ROCnROLL: | 2 | |
| TRIX (15,9): | 0.0800 | |
| Courbe Coppock: | 0.91 |
| MA7: | 28.27 | |
| MA20: | 28.12 | |
| MA50: | 27.77 | |
| MA100: | 27.23 | |
| MAexp7: | 27.94 | |
| MAexp20: | 28.09 | |
| MAexp50: | 27.85 | |
| MAexp100: | 27.45 | |
| Price / MA7: | -3.61% | |
| Price / MA20: | -3.09% | |
| Price / MA50: | -1.87% | |
| Price / MA100: | +0.07% | |
| Price / MAexp7: | -2.47% | |
| Price / MAexp20: | -2.99% | |
| Price / MAexp50: | -2.15% | |
| Price / MAexp100: | -0.73% |
News
The last news published on UNITED COMMUNITY BANKS INC. at the time of the generation of this analysis was as follows:
- Investor Network: United Community Banks, Inc. to Host Earnings Call
- United Community Banks, Inc. Announces Fourth Quarter Earnings
- United Community Banks, Inc. Announces Date for Fourth Quarter and Full Year 2016 Earnings Release and Conference Call
- United Community Banks, Inc. Announces Chief Financial Officer’s Retirement in 2017
- United Community Banks, Inc. to Participate in the 2016 Sandler O’Neill + Partners, L.P. East Coast Financial Services Conference
About author

Online


Add a comment
Comments
0 comments on the analysis UNITED COMMUNITY BANKS INC. - Daily