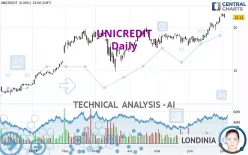
UNICREDIT - Daily - Technical analysis published on 07/05/2023 (GMT)
- 195
- 0
Click here for a new analysis!
- Timeframe : Daily
- - Analysis generated on
- Status : LEVEL MAINTAINED

Summary of the analysis

Additional analysis
Quotes
The UNICREDIT rating is 21.355 EUR. The price has increased by +1.07% since the last closing with the lowest point at 20.960 EUR and the highest point at 21.450 EUR. The deviation from the price is +1.88% for the low point and -0.44% for the high point.The Central Gaps scanner detects the formation of a bearish gap marking the strong presence of sellers ahead of buyers at the opening. This formed a quotation gap.
Opening Gap DOWN
Type : Bearish
Timeframe : Openning
A study of price movements over other periods shows the following variations:
New HIGH record (5 years)
Type : Bullish
Timeframe : Weekly
Near a new HIGH record (1 year)
Type : Bullish
Timeframe : Weekly
Near a new HIGH record (1st january)
Type : Bullish
Timeframe : Weekly
Near a new HIGH record (1 month)
Type : Bullish
Timeframe : Weekly
Technical
Technical analysis of UNICREDIT in Daily shows a strongly overall bullish trend. 92.86% of the signals given by moving averages are bullish. This strongly bullish trend is supported by the strong bullish signals given by short-term moving averages. The Central Indicators market scanner currently does not detect any result that concerns moving averages.
An assessment of technical indicators shows a strong bullish signal.
But beware of excesses. The Central Indicators scanner currently detects this:
Williams %R indicator is overbought : over -20
Type : Neutral
Timeframe : Daily
Price is back over the pivot point
Type : Bullish
Timeframe : Daily
The analysis of the price chart with Central Patterns scanners does not return any result.
Central Candlesticks, the scanner specialised in Japanese candlesticks, detects a bullish signal that could support the hypothesis of a small rebound in the very short term:
Piercing line
Type : Bullish
Timeframe : Daily
| S3 | S2 | S1 | Price | R1 | R2 | R3 | |
|---|---|---|---|---|---|---|---|
| ProTrendLines | 18.347 | 19.739 | 20.550 | 21.355 | 28.855 | 68.577 | 171.315 |
| Change (%) | -14.09% | -7.57% | -3.77% | - | +35.12% | +221.13% | +702.22% |
| Change | -3.008 | -1.616 | -0.805 | - | +7.500 | +47.222 | +149.960 |
| Level | Intermediate | Major | Major | - | Intermediate | Minor | Intermediate |
Pivot points can also be used to set your price objectives. Here is the price situation in relation to pivot points:
| Pivot points | S3 | S2 | S1 | PP | R1 | R2 | R3 |
|---|---|---|---|---|---|---|---|
| Standard | 20.480 | 20.800 | 20.965 | 21.285 | 21.450 | 21.770 | 21.935 |
| Camarilla | 20.997 | 21.041 | 21.086 | 21.130 | 21.175 | 21.219 | 21.263 |
| Woodie | 20.403 | 20.761 | 20.888 | 21.246 | 21.373 | 21.731 | 21.858 |
| Fibonacci | 20.800 | 20.985 | 21.100 | 21.285 | 21.470 | 21.585 | 21.770 |
| Pivot points | S3 | S2 | S1 | PP | R1 | R2 | R3 |
|---|---|---|---|---|---|---|---|
| Standard | 18.113 | 18.866 | 20.065 | 20.818 | 22.017 | 22.770 | 23.969 |
| Camarilla | 20.728 | 20.907 | 21.086 | 21.265 | 21.444 | 21.623 | 21.802 |
| Woodie | 18.337 | 18.978 | 20.289 | 20.930 | 22.241 | 22.882 | 24.193 |
| Fibonacci | 18.866 | 19.611 | 20.072 | 20.818 | 21.563 | 22.024 | 22.770 |
| Pivot points | S3 | S2 | S1 | PP | R1 | R2 | R3 |
|---|---|---|---|---|---|---|---|
| Standard | 15.657 | 16.900 | 19.083 | 20.326 | 22.509 | 23.752 | 25.935 |
| Camarilla | 20.323 | 20.637 | 20.951 | 21.265 | 21.579 | 21.893 | 22.207 |
| Woodie | 16.126 | 17.135 | 19.552 | 20.561 | 22.978 | 23.987 | 26.404 |
| Fibonacci | 16.900 | 18.209 | 19.018 | 20.326 | 21.635 | 22.444 | 23.752 |
Numerical data
The following are the details of the technical indicators and moving averages that were collected to generate this technical analysis:
| RSI (14): | 68.75 | |
| MACD (12,26,9): | 0.6720 | |
| Directional Movement: | 15.072 | |
| AROON (14): | 78.571 | |
| DEMA (21): | 21.068 | |
| Parabolic SAR (0,02-0,02-0,2): | 20.522 | |
| Elder Ray (13): | 0.578 | |
| Super Trend (3,10): | 19.995 | |
| Zig ZAG (10): | 21.345 | |
| VORTEX (21): | 1.2280 | |
| Stochastique (14,3,5): | 88.84 | |
| TEMA (21): | 21.457 | |
| Williams %R (14): | -10.50 | |
| Chande Momentum Oscillator (20): | 1.649 | |
| Repulse (5,40,3): | 1.0370 | |
| ROCnROLL: | 1 | |
| TRIX (15,9): | 0.4020 | |
| Courbe Coppock: | 22.54 |
| MA7: | 21.071 | |
| MA20: | 19.980 | |
| MA50: | 19.172 | |
| MA100: | 18.712 | |
| MAexp7: | 21.033 | |
| MAexp20: | 20.254 | |
| MAexp50: | 19.403 | |
| MAexp100: | 18.351 | |
| Price / MA7: | +1.35% | |
| Price / MA20: | +6.88% | |
| Price / MA50: | +11.39% | |
| Price / MA100: | +14.12% | |
| Price / MAexp7: | +1.53% | |
| Price / MAexp20: | +5.44% | |
| Price / MAexp50: | +10.06% | |
| Price / MAexp100: | +16.37% |
News
The latest news and videos published on UNICREDIT at the time of the analysis were as follows:
- Spectrum Markets welcomes UniCredit Bank AG as newest member with listing of securitised derivatives
-
 Francesca Nenci, global head of trade, UniCredit - View from Sibos 2021
- SDS Reinforces Product Management With UniCredit Top Manager Susanna Scheffold
- Almonty Announces the Execution of an Amended and Restated Loan Agreement with Unicredit Bank AG
- UniCredit Bank AG: Stabilisation Notice
About author
Online


Add a comment
Comments
0 comments on the analysis UNICREDIT - Daily