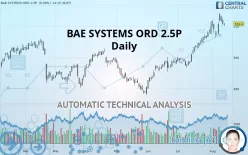
BAE SYSTEMS ORD 2.5P - Daily - Technical analysis published on 08/13/2019 (GMT)
- 519
- 0
- Who voted?
Click here for a new analysis!
- Timeframe : Daily
- - Analysis generated on
- Status : TARGET REACHED

Summary of the analysis

Additional analysis
Quotes
The BAE SYSTEMS ORD 2.5P rating is 553.4 GBX. The price has increased by +0.00% since the last closing and was traded between 550.0 GBX and 555.0 GBX over the period. The price is currently at +0.62% from its lowest and -0.29% from its highest.A bearish opening was detected by the Central Gaps scanner. Sellers are trying to impose a bearish trend in the very short term.
Bearish opening
Type : Bearish
Timeframe : Openning
Here is a more detailed summary of the historical variations registered by BAE SYSTEMS ORD 2.5P:
Near a new HIGH record (1st january)
Type : Bullish
Timeframe : Weekly
Near a new HIGH record (1 month)
Type : Bullish
Timeframe : Weekly
Technical
Technical analysis of BAE SYSTEMS ORD 2.5P in Daily shows a strongly overall bullish trend. 92.86% of the signals given by moving averages are bullish. This strongly bullish trend is supported by the strong bullish signals given by short-term moving averages. There is no crossing of moving average by the price or crossing of moving averages between themselves.
The probability of a further increase are moderate given the direction of the technical indicators.
Caution: the Central Indicators scanner currently detects an excess:
CCI indicator is overbought : over 100
Type : Neutral
Timeframe : Daily
Williams %R indicator is overbought : over -20
Type : Neutral
Timeframe : Daily
Price is back over the pivot point
Type : Bullish
Timeframe : Weekly
Price is back under the pivot point
Type : Bearish
Timeframe : Daily
An analysis of the price chart with the Central Patterns scanner (detector of chart patterns and resistances and supports) shows a result that can have an impact on the price change:
Near resistance of channel
Type : Bearish
Timeframe : Daily
The Central Candlesticks scanner, specialised in Japanese candlesticks, did not identify any signals.
| S3 | S2 | S1 | Price | R1 | R2 | R3 | |
|---|---|---|---|---|---|---|---|
| ProTrendLines | 487.2 | 511.2 | 535.5 | 553.4 | 559.3 | 582.6 | 635.7 |
| Change (%) | -11.96% | -7.63% | -3.23% | - | +1.07% | +5.28% | +14.87% |
| Change | -66.2 | -42.2 | -17.9 | - | +5.9 | +29.2 | +82.3 |
| Level | Intermediate | Intermediate | Major | - | Major | Minor | Minor |
Pivot points can also be used to set your price objectives. Here is the price situation in relation to pivot points:
| Pivot points | S3 | S2 | S1 | PP | R1 | R2 | R3 |
|---|---|---|---|---|---|---|---|
| Standard | 536.9 | 544.1 | 548.7 | 555.9 | 560.5 | 567.7 | 572.3 |
| Camarilla | 550.2 | 551.2 | 552.3 | 553.4 | 554.5 | 555.6 | 556.7 |
| Woodie | 535.7 | 543.5 | 547.5 | 555.3 | 559.3 | 567.1 | 571.1 |
| Fibonacci | 544.1 | 548.6 | 551.4 | 555.9 | 560.4 | 563.2 | 567.7 |
| Pivot points | S3 | S2 | S1 | PP | R1 | R2 | R3 |
|---|---|---|---|---|---|---|---|
| Standard | 497.7 | 514.9 | 536.7 | 553.9 | 575.7 | 592.9 | 614.7 |
| Camarilla | 547.9 | 551.5 | 555.0 | 558.6 | 562.2 | 565.8 | 569.3 |
| Woodie | 500.1 | 516.1 | 539.1 | 555.1 | 578.1 | 594.1 | 617.1 |
| Fibonacci | 514.9 | 529.8 | 539.0 | 553.9 | 568.8 | 578.0 | 592.9 |
| Pivot points | S3 | S2 | S1 | PP | R1 | R2 | R3 |
|---|---|---|---|---|---|---|---|
| Standard | 428.7 | 455.9 | 502.3 | 529.5 | 575.9 | 603.1 | 649.5 |
| Camarilla | 528.4 | 535.1 | 541.9 | 548.6 | 555.4 | 562.1 | 568.8 |
| Woodie | 438.2 | 460.7 | 511.8 | 534.3 | 585.4 | 607.9 | 659.0 |
| Fibonacci | 455.9 | 484.1 | 501.4 | 529.5 | 557.7 | 575.0 | 603.1 |
Numerical data
The following is the status of the technical indicators and moving averages at the time of publication of this technical analysis:
| RSI (14): | 63.30 | |
| MACD (12,26,9): | 14.1000 | |
| Directional Movement: | 20.1 | |
| AROON (14): | 78.6 | |
| DEMA (21): | 558.6 | |
| Parabolic SAR (0,02-0,02-0,2): | 534.3 | |
| Elder Ray (13): | 5.5 | |
| Super Trend (3,10): | 528.8 | |
| Zig ZAG (10): | 553.4 | |
| VORTEX (21): | 1.1000 | |
| Stochastique (14,3,5): | 65.70 | |
| TEMA (21): | 561.7 | |
| Williams %R (14): | -41.40 | |
| Chande Momentum Oscillator (20): | 19.4 | |
| Repulse (5,40,3): | -0.2000 | |
| ROCnROLL: | 1 | |
| TRIX (15,9): | 0.4000 | |
| Courbe Coppock: | 10.00 |
| MA7: | 551.8 | |
| MA20: | 540.5 | |
| MA50: | 510.1 | |
| MA100: | 491.7 | |
| MAexp7: | 552.7 | |
| MAexp20: | 539.8 | |
| MAexp50: | 517.4 | |
| MAexp100: | 503.3 | |
| Price / MA7: | +0.29% | |
| Price / MA20: | +2.39% | |
| Price / MA50: | +8.49% | |
| Price / MA100: | +12.55% | |
| Price / MAexp7: | +0.13% | |
| Price / MAexp20: | +2.52% | |
| Price / MAexp50: | +6.96% | |
| Price / MAexp100: | +9.95% |
News
Don"t forget to follow the news on BAE SYSTEMS ORD 2.5P. At the time of publication of this analysis, the latest news was as follows:
-
 BAE Systems to supply Riyadh with arms despite the scathing court ruling
- BAE Systems Launches Major Update to its Financial Crime & Compliance Platform, NetReveal
- BAE Systems Launches Major Update to its Financial Crime & Compliance Platform, NetReveal
- Spire Global And BAE Systems To Power Geospatial eXploitation Products™ With AIS Data
- BAE Systems Honors VIAVI Solutions with a Supplier of the Year Award
About author

Online


Add a comment
Comments
0 comments on the analysis BAE SYSTEMS ORD 2.5P - Daily