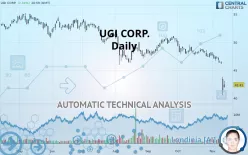
UGI CORP. - Daily - Technical analysis published on 11/14/2019 (GMT)
- 243
- 0
- Who voted?
Click here for a new analysis!
- Timeframe : Daily
- - Analysis generated on
- Status : INVALID

Summary of the analysis

Additional analysis
Quotes
The UGI CORP. rating is 42.41 USD. The price has increased by +2.34% since the last closing with the lowest point at 41.84 USD and the highest point at 43.08 USD. The deviation from the price is +1.36% for the low point and -1.56% for the high point.The Central Gaps scanner detects a bullish opening. A small advantage for buyers in the very short term.
Bullish opening
Type : Bullish
Timeframe : Openning
Here is a more detailed summary of the historical variations registered by UGI CORP.:
Near a new LOW record (1 year)
Type : Bearish
Timeframe : Weekly
Near a new LOW record (1st january)
Type : Bearish
Timeframe : Weekly
Near a new LOW record (1 month)
Type : Bearish
Timeframe : Weekly
Technical
A technical analysis in Daily of this UGI CORP. chart shows a sharp bearish trend. 92.86% of the signals given by moving averages are bearish. This strongly bearish trend is supported by the strong bearish signals given by short-term moving averages. The Central Indicators scanner detects a bearish signal on moving averages that could impact this trend:
Moving Average bearish crossovers : AMA50 & AMA100
Type : Bearish
Timeframe : Daily
An assessment of technical indicators does not currently provide any relevant information on the direction of future price movements.
But beware of excesses. The Central Indicators scanner currently detects this:
RSI indicator is oversold : under 20
Type : Neutral
Timeframe : Daily
CCI indicator is oversold : under -100
Type : Neutral
Timeframe : Daily
Williams %R indicator is oversold : under -80
Type : Neutral
Timeframe : Daily
Pivot points : price is under support 3
Type : Neutral
Timeframe : Weekly
Price is back under the pivot point
Type : Bearish
Timeframe : Daily
The Central Patterns scanner, which studies chart patterns, resistances and supports, has identified these signals:
Near horizontal support
Type : Bullish
Timeframe : Daily
Support of channel is broken
Type : Bearish
Timeframe : Daily
The presence of these bearish patterns in Japanese candlesticks detected by Central Candlesticks that could cause a correction in the very short term were also noted
Downside gap
Type : Bearish
Timeframe : Daily
Long black line
Type : Bearish
Timeframe : Daily
| S3 | S2 | S1 | Price | R1 | R2 | R3 | |
|---|---|---|---|---|---|---|---|
| ProTrendLines | 19.58 | 31.71 | 39.40 | 42.41 | 42.53 | 44.36 | 46.57 |
| Change (%) | -53.83% | -25.23% | -7.10% | - | +0.28% | +4.60% | +9.81% |
| Change | -22.83 | -10.70 | -3.01 | - | +0.12 | +1.95 | +4.16 |
| Level | Intermediate | Minor | Minor | - | Major | Minor | Major |
Pivot points can also be used to set your price objectives. Here is the price situation in relation to pivot points:
| Pivot points | S3 | S2 | S1 | PP | R1 | R2 | R3 |
|---|---|---|---|---|---|---|---|
| Standard | 36.77 | 38.65 | 40.04 | 41.92 | 43.31 | 45.19 | 46.58 |
| Camarilla | 40.54 | 40.84 | 41.14 | 41.44 | 41.74 | 42.04 | 42.34 |
| Woodie | 36.54 | 38.53 | 39.81 | 41.80 | 43.08 | 45.07 | 46.35 |
| Fibonacci | 38.65 | 39.90 | 40.67 | 41.92 | 43.17 | 43.94 | 45.19 |
| Pivot points | S3 | S2 | S1 | PP | R1 | R2 | R3 |
|---|---|---|---|---|---|---|---|
| Standard | 44.25 | 45.25 | 45.90 | 46.90 | 47.55 | 48.55 | 49.20 |
| Camarilla | 46.09 | 46.24 | 46.39 | 46.54 | 46.69 | 46.84 | 46.99 |
| Woodie | 44.07 | 45.16 | 45.72 | 46.81 | 47.37 | 48.46 | 49.02 |
| Fibonacci | 45.25 | 45.88 | 46.27 | 46.90 | 47.53 | 47.92 | 48.55 |
| Pivot points | S3 | S2 | S1 | PP | R1 | R2 | R3 |
|---|---|---|---|---|---|---|---|
| Standard | 43.27 | 45.25 | 46.46 | 48.43 | 49.64 | 51.62 | 52.83 |
| Camarilla | 46.79 | 47.09 | 47.38 | 47.67 | 47.96 | 48.25 | 48.55 |
| Woodie | 42.89 | 45.06 | 46.08 | 48.24 | 49.26 | 51.43 | 52.45 |
| Fibonacci | 45.25 | 46.46 | 47.22 | 48.43 | 49.65 | 50.40 | 51.62 |
Numerical data
The following are the details of the technical indicators and moving averages that were collected to generate this technical analysis:
| RSI (14): | 23.47 | |
| MACD (12,26,9): | -1.2400 | |
| Directional Movement: | -44.03 | |
| AROON (14): | -92.86 | |
| DEMA (21): | 45.17 | |
| Parabolic SAR (0,02-0,02-0,2): | 46.53 | |
| Elder Ray (13): | -3.40 | |
| Super Trend (3,10): | 45.71 | |
| Zig ZAG (10): | 42.41 | |
| VORTEX (21): | 0.7700 | |
| Stochastique (14,3,5): | 13.11 | |
| TEMA (21): | 44.31 | |
| Williams %R (14): | -76.58 | |
| Chande Momentum Oscillator (20): | -5.05 | |
| Repulse (5,40,3): | -3.4300 | |
| ROCnROLL: | 2 | |
| TRIX (15,9): | -0.2000 | |
| Courbe Coppock: | 12.58 |
| MA7: | 45.41 | |
| MA20: | 47.07 | |
| MA50: | 48.40 | |
| MA100: | 49.24 | |
| MAexp7: | 44.75 | |
| MAexp20: | 46.56 | |
| MAexp50: | 47.89 | |
| MAexp100: | 49.06 | |
| Price / MA7: | -6.61% | |
| Price / MA20: | -9.90% | |
| Price / MA50: | -12.38% | |
| Price / MA100: | -13.87% | |
| Price / MAexp7: | -5.23% | |
| Price / MAexp20: | -8.91% | |
| Price / MAexp50: | -11.44% | |
| Price / MAexp100: | -13.55% |
News
Don"t forget to follow the news on UGI CORP.. At the time of publication of this analysis, the latest news was as follows:
- UGI Corporation to Hold 4QFY19 Earnings Conference Call and Webcast on Tuesday, November 12
- UGI Corporation Elects Two Directors; Announces Board Succession Plan
- UGI Declares Common Dividend
- UGI to Present at the 2019 AGA Financial Forum on Wednesday, May 22
- UGI Corporation to Host Earnings Call
About author

Online


Add a comment
Comments
0 comments on the analysis UGI CORP. - Daily