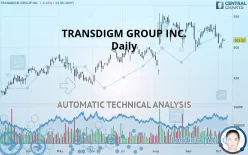
TRANSDIGM GROUP INC. - Daily - Technical analysis published on 10/07/2019 (GMT)
- 302
- 0
- Who voted?
Click here for a new analysis!
- Timeframe : Daily
- - Analysis generated on
- Status : LEVEL MAINTAINED

Summary of the analysis

Additional analysis
Quotes
TRANSDIGM GROUP INC. rating 511.32 USD. The price is lower by -0.45% since the last closing and was traded between 510.31 USD and 511.87 USD over the period. The price is currently at +0.20% from its lowest and -0.11% from its highest.The Central Gaps scanner detects a bullish gap which is a sign that buyers have taken the lead in the very short term.
Opening Gap UP
Type : Bullish
Timeframe : Openning
A study of price movements over other periods shows the following variations:
Technical
Technical analysis of TRANSDIGM GROUP INC. in Daily shows an overall slightly bullish trend. 53.57% of the signals given by moving averages are bullish. Caution: the strong bearish signals currently being given by short-term moving averages indicate that this slightly bullish trend could be reversed. An assessment of moving averages reveals several bullish signals that could impact this trend:
Bullish price crossover with adaptative moving average 20
Type : Bullish
Timeframe : Daily
Bullish price crossover with adaptative moving average 50
Type : Bullish
Timeframe : Daily
Bullish price crossover with adaptative moving average 100
Type : Bullish
Timeframe : Daily
An assessment of technical indicators does not currently provide any relevant information to suggest whether the signal given by the technical indicators is more bullish or bearish.
Caution: the Central Indicators scanner currently detects an excess:
CCI indicator is oversold : under -100
Type : Neutral
Timeframe : Daily
MACD indicator: bullish divergence
Type : Bullish
Timeframe : Daily
Price is back over the pivot point
Type : Bullish
Timeframe : Daily
Price is back under the pivot point
Type : Bearish
Timeframe : Weekly
Central Patterns, the scanner specializing in chart patterns, did not identify any signals.
For a small rebound in the very short term, the Central Candlesticks scanner currently notes the presence of this bullish pattern in Japanese candlesticks:
Bullish engulfing lines
Type : Bullish
Timeframe : Daily
| S3 | S2 | S1 | Price | R1 | R2 | |
|---|---|---|---|---|---|---|
| ProTrendLines | 440.66 | 461.33 | 483.05 | 511.32 | 530.78 | 550.83 |
| Change (%) | -13.82% | -9.78% | -5.53% | - | +3.81% | +7.73% |
| Change | -70.66 | -49.99 | -28.27 | - | +19.46 | +39.51 |
| Level | Intermediate | Major | Intermediate | - | Major | Major |
Pivot points can also be used to set your price objectives. Here is the price situation in relation to pivot points:
| Pivot points | S3 | S2 | S1 | PP | R1 | R2 | R3 |
|---|---|---|---|---|---|---|---|
| Standard | 490.62 | 493.98 | 500.60 | 503.96 | 510.58 | 513.94 | 520.56 |
| Camarilla | 504.49 | 505.40 | 506.32 | 507.23 | 508.15 | 509.06 | 509.98 |
| Woodie | 492.26 | 494.80 | 502.24 | 504.78 | 512.22 | 514.76 | 522.20 |
| Fibonacci | 493.98 | 497.79 | 500.14 | 503.96 | 507.77 | 510.12 | 513.94 |
| Pivot points | S3 | S2 | S1 | PP | R1 | R2 | R3 |
|---|---|---|---|---|---|---|---|
| Standard | 488.29 | 501.85 | 510.02 | 523.58 | 531.75 | 545.31 | 553.48 |
| Camarilla | 512.21 | 514.21 | 516.20 | 518.19 | 520.18 | 522.17 | 524.17 |
| Woodie | 485.60 | 500.50 | 507.33 | 522.23 | 529.06 | 543.96 | 550.79 |
| Fibonacci | 501.85 | 510.15 | 515.28 | 523.58 | 531.88 | 537.01 | 545.31 |
| Pivot points | S3 | S2 | S1 | PP | R1 | R2 | R3 |
|---|---|---|---|---|---|---|---|
| Standard | 445.99 | 469.50 | 495.09 | 518.59 | 544.18 | 567.69 | 593.27 |
| Camarilla | 507.17 | 511.67 | 516.17 | 520.67 | 525.17 | 529.67 | 534.17 |
| Woodie | 447.03 | 470.02 | 496.12 | 519.11 | 545.22 | 568.21 | 594.31 |
| Fibonacci | 469.50 | 488.26 | 499.84 | 518.59 | 537.35 | 548.93 | 567.69 |
Numerical data
The following are the details of the technical indicators and moving averages that were collected to generate this technical analysis:
| RSI (14): | 46.71 | |
| MACD (12,26,9): | -2.7900 | |
| Directional Movement: | -7.93 | |
| AROON (14): | -28.57 | |
| DEMA (21): | 516.23 | |
| Parabolic SAR (0,02-0,02-0,2): | 548.73 | |
| Elder Ray (13): | -6.64 | |
| Super Trend (3,10): | 499.56 | |
| Zig ZAG (10): | 513.61 | |
| VORTEX (21): | 0.8800 | |
| Stochastique (14,3,5): | 23.85 | |
| TEMA (21): | 510.59 | |
| Williams %R (14): | -59.11 | |
| Chande Momentum Oscillator (20): | -16.77 | |
| Repulse (5,40,3): | 1.1300 | |
| ROCnROLL: | 2 | |
| TRIX (15,9): | -0.0300 | |
| Courbe Coppock: | 3.24 |
| MA7: | 511.04 | |
| MA20: | 518.64 | |
| MA50: | 519.88 | |
| MA100: | 497.72 | |
| MAexp7: | 512.64 | |
| MAexp20: | 518.56 | |
| MAexp50: | 515.15 | |
| MAexp100: | 499.06 | |
| Price / MA7: | +0.05% | |
| Price / MA20: | -1.41% | |
| Price / MA50: | -1.65% | |
| Price / MA100: | +2.73% | |
| Price / MAexp7: | -0.26% | |
| Price / MAexp20: | -1.40% | |
| Price / MAexp50: | -0.74% | |
| Price / MAexp100: | +2.46% |
News
Don"t forget to follow the news on TRANSDIGM GROUP INC.. At the time of publication of this analysis, the latest news was as follows:
- TransDigm Group Provides Update on Divestitures
- TransDigm Group Plans to Divest Esterline Interface Technologies Group of Businesses to an Affiliate of KPS Capital Partners, LP
- TransDigm Group Plans to Divest Esterline Interface Technologies Group of Businesses to an Affiliate of KPS Capital Partners, LP
- TransDigm Group Reports Fiscal 2019 Third Quarter Results and Declares a Special Cash Dividend of $30.00 Per Share
- TransDigm Group Reports Fiscal 2019 Third Quarter Results and Declares a Special Cash Dividend of $30.00 Per Share
About author

Online


Add a comment
Comments
0 comments on the analysis TRANSDIGM GROUP INC. - Daily