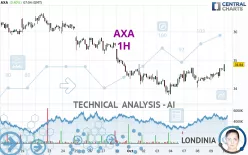
AXA - 1H - Technical analysis published on 10/10/2024 (GMT)
- 126
- 0
Click here for a new analysis!
- Timeframe : 1H
- - Analysis generated on
- Status : LEVEL MAINTAINED

Summary of the analysis

Additional analysis
Quotes
AXA rating 34.84 EUR. The price has increased by +0.40% since the last closing and was traded between 34.59 EUR and 34.85 EUR over the period. The price is currently at +0.72% from its lowest and -0.03% from its highest.The Central Gaps scanner detects a bullish gap which is a sign that buyers have taken the lead in the very short term.
Opening Gap UP
Type : Bullish
Timeframe : Openning
Here is a more detailed summary of the historical variations registered by AXA:
Near a new LOW record (1 month)
Type : Bearish
Timeframe : Weekly
Technical
Technical analysis of this 1H chart of AXA indicates that the overall trend is slightly bullish. Only 53.57% of the signals given by moving averages are bullish. This slightly bullish trend is reinforced by the strong signals currently being given by short-term moving averages. The Central Indicators scanner does not detect any result on moving averages that would impact this trend.
Technical indicators are strongly bullish, suggesting that the price increase should continue.
Caution: the Central Indicators scanner currently detects an excess:
CCI indicator is overbought : over 100
Type : Neutral
Timeframe : 1 hour
Williams %R indicator is overbought : over -20
Type : Neutral
Timeframe : 1 hour
Pivot points : price is over resistance 2
Type : Neutral
Timeframe : 1 hour
An analysis of the price chart with the Central Patterns scanner (detector of chart patterns and resistances and supports) shows several results that can have an impact on the price change:
Near resistance of channel
Type : Bearish
Timeframe : 1 hour
Near resistance of triangle
Type : Bearish
Timeframe : 1 hour
The Central Candlesticks scanner, specialised in Japanese candlesticks, did not identify any signals.
| S3 | S2 | S1 | Price | R1 | R2 | R3 | |
|---|---|---|---|---|---|---|---|
| ProTrendLines | 33.91 | 34.34 | 34.74 | 34.84 | 35.35 | 35.88 | 36.25 |
| Change (%) | -2.67% | -1.44% | -0.29% | - | +1.46% | +2.99% | +4.05% |
| Change | -0.93 | -0.50 | -0.10 | - | +0.51 | +1.04 | +1.41 |
| Level | Major | Minor | Intermediate | - | Minor | Minor | Intermediate |
To determine price objectives, it is also possible to use the pivot points. Here is the price position in relation to pivot points:
| Pivot points | S3 | S2 | S1 | PP | R1 | R2 | R3 |
|---|---|---|---|---|---|---|---|
| Standard | 33.99 | 34.13 | 34.42 | 34.56 | 34.85 | 34.99 | 35.28 |
| Camarilla | 34.58 | 34.62 | 34.66 | 34.70 | 34.74 | 34.78 | 34.82 |
| Woodie | 34.06 | 34.17 | 34.49 | 34.60 | 34.92 | 35.03 | 35.35 |
| Fibonacci | 34.13 | 34.30 | 34.40 | 34.56 | 34.73 | 34.83 | 34.99 |
| Pivot points | S3 | S2 | S1 | PP | R1 | R2 | R3 |
|---|---|---|---|---|---|---|---|
| Standard | 31.99 | 32.88 | 33.62 | 34.51 | 35.25 | 36.14 | 36.88 |
| Camarilla | 33.92 | 34.07 | 34.22 | 34.37 | 34.52 | 34.67 | 34.82 |
| Woodie | 31.93 | 32.84 | 33.56 | 34.47 | 35.19 | 36.10 | 36.82 |
| Fibonacci | 32.88 | 33.50 | 33.88 | 34.51 | 35.13 | 35.51 | 36.14 |
| Pivot points | S3 | S2 | S1 | PP | R1 | R2 | R3 |
|---|---|---|---|---|---|---|---|
| Standard | 30.94 | 32.51 | 33.52 | 35.09 | 36.10 | 37.67 | 38.68 |
| Camarilla | 33.82 | 34.06 | 34.29 | 34.53 | 34.77 | 35.00 | 35.24 |
| Woodie | 30.66 | 32.37 | 33.24 | 34.95 | 35.82 | 37.53 | 38.40 |
| Fibonacci | 32.51 | 33.50 | 34.10 | 35.09 | 36.08 | 36.68 | 37.67 |
Numerical data
The following is the status of the technical indicators and moving averages at the time of publication of this technical analysis:
| RSI (14): | 60.67 | |
| MACD (12,26,9): | 0.0700 | |
| Directional Movement: | 5.96 | |
| AROON (14): | 78.57 | |
| DEMA (21): | 34.57 | |
| Parabolic SAR (0,02-0,02-0,2): | 34.19 | |
| Elder Ray (13): | 0.15 | |
| Super Trend (3,10): | 34.24 | |
| Zig ZAG (10): | 34.70 | |
| VORTEX (21): | 0.9800 | |
| Stochastique (14,3,5): | 97.10 | |
| TEMA (21): | 34.65 | |
| Williams %R (14): | -2.17 | |
| Chande Momentum Oscillator (20): | 0.31 | |
| Repulse (5,40,3): | 0.5500 | |
| ROCnROLL: | 1 | |
| TRIX (15,9): | 0.0200 | |
| Courbe Coppock: | 1.34 |
| MA7: | 34.38 | |
| MA20: | 35.34 | |
| MA50: | 34.23 | |
| MA100: | 33.10 | |
| MAexp7: | 34.60 | |
| MAexp20: | 34.49 | |
| MAexp50: | 34.50 | |
| MAexp100: | 34.73 | |
| Price / MA7: | +1.34% | |
| Price / MA20: | -1.41% | |
| Price / MA50: | +1.78% | |
| Price / MA100: | +5.26% | |
| Price / MAexp7: | +0.69% | |
| Price / MAexp20: | +1.01% | |
| Price / MAexp50: | +0.99% | |
| Price / MAexp100: | +0.32% |
News
The latest news and videos published on AXA at the time of the analysis were as follows:
- "Green Power Hike 2025" (50km/25km/10km) Opens for Registration
- AXA celebrates 35th anniversary in Macau, presenting a series of engaging events for the public
- AXA Study: Hong Kong workers buckling under high stress and poor mind health
- AXA Launches Pioneering Heatwave Parametric Insurance
- AXA and Trip.com Strengthen Global Strategic Partnership with the Launch of "Trip.com Travel Smart"
About author
Online


Add a comment
Comments
0 comments on the analysis AXA - 1H