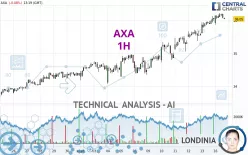
AXA - 1H - Technical analysis published on 09/16/2024 (GMT)
- 134
- 0
Click here for a new analysis!
- Timeframe : 1H
- - Analysis generated on
- Status : LEVEL MAINTAINED

Summary of the analysis

Additional analysis
Quotes
The AXA rating is 36.05 EUR. On the day, this instrument lost -0.08% and was traded between 35.87 EUR and 36.23 EUR over the period. The price is currently at +0.50% from its lowest and -0.50% from its highest.The Central Gaps scanner detects a bearish opening marking the presence of sellers ahead of buyers at the opening but not sufficiently marked to allow the price to register a quotation gap.
Bearish opening
Type : Bearish
Timeframe : Openning
Here is a more detailed summary of the historical variations registered by AXA:
New HIGH record (5 years)
Type : Bullish
Timeframe : Weekly
New HIGH record (1 year)
Type : Bullish
Timeframe : Weekly
New HIGH record (1st january)
Type : Bullish
Timeframe : Weekly
New HIGH record (1 month)
Type : Bullish
Timeframe : Weekly
Technical
A technical analysis in 1H of this AXA chart shows a strongly bullish trend. The signals given by the moving averages are 92.86% bullish. This strong bullish trend is confirmed by the strong signals currently being given by short-term moving averages. The Central Indicators market scanner currently does not detect any result that concerns moving averages.
An assessment of technical indicators shows a moderate bullish signal.
The Central Indicators scanner specialised in technical indicators, has not detected anything further.
An analysis of the price chart with the Central Patterns scanner (detector of chart patterns and resistances and supports) shows a result that can have an impact on the price change:
Near horizontal support
Type : Bullish
Timeframe : 1 hour
From the Japanese candlestick perspective, the Central Candlesticks scanner notes the presence of these results that could impact the short-term trend:
Bullish doji star
Type : Bullish
Timeframe : 1 hour
Doji
Type : Neutral
Timeframe : 1 hour
| S3 | S2 | S1 | Price | |
|---|---|---|---|---|
| ProTrendLines | 34.44 | 34.98 | 35.72 | 36.05 |
| Change (%) | -4.47% | -2.97% | -0.92% | - |
| Change | -1.61 | -1.07 | -0.33 | - |
| Level | Intermediate | Minor | Intermediate | - |
To determine price objectives, it is also possible to use the pivot points. Here is the price position in relation to pivot points:
| Pivot points | S3 | S2 | S1 | PP | R1 | R2 | R3 |
|---|---|---|---|---|---|---|---|
| Standard | 35.22 | 35.41 | 35.75 | 35.94 | 36.28 | 36.47 | 36.81 |
| Camarilla | 35.93 | 35.98 | 36.03 | 36.08 | 36.13 | 36.18 | 36.23 |
| Woodie | 35.29 | 35.45 | 35.82 | 35.98 | 36.35 | 36.51 | 36.88 |
| Fibonacci | 35.41 | 35.62 | 35.74 | 35.94 | 36.15 | 36.27 | 36.47 |
| Pivot points | S3 | S2 | S1 | PP | R1 | R2 | R3 |
|---|---|---|---|---|---|---|---|
| Standard | 33.42 | 33.97 | 35.03 | 35.58 | 36.64 | 37.19 | 38.25 |
| Camarilla | 35.64 | 35.79 | 35.93 | 36.08 | 36.23 | 36.38 | 36.52 |
| Woodie | 33.67 | 34.10 | 35.28 | 35.71 | 36.89 | 37.32 | 38.50 |
| Fibonacci | 33.97 | 34.59 | 34.97 | 35.58 | 36.20 | 36.58 | 37.19 |
| Pivot points | S3 | S2 | S1 | PP | R1 | R2 | R3 |
|---|---|---|---|---|---|---|---|
| Standard | 28.60 | 29.78 | 32.09 | 33.27 | 35.58 | 36.76 | 39.07 |
| Camarilla | 33.44 | 33.76 | 34.08 | 34.40 | 34.72 | 35.04 | 35.36 |
| Woodie | 29.17 | 30.06 | 32.66 | 33.55 | 36.15 | 37.04 | 39.64 |
| Fibonacci | 29.78 | 31.11 | 31.94 | 33.27 | 34.60 | 35.43 | 36.76 |
Numerical data
The following is the status of the technical indicators and moving averages at the time of publication of this technical analysis:
| RSI (14): | 64.58 | |
| MACD (12,26,9): | 0.1900 | |
| Directional Movement: | 8.83 | |
| AROON (14): | 78.57 | |
| DEMA (21): | 36.20 | |
| Parabolic SAR (0,02-0,02-0,2): | 35.94 | |
| Elder Ray (13): | 0.05 | |
| Super Trend (3,10): | 35.76 | |
| Zig ZAG (10): | 36.07 | |
| VORTEX (21): | 1.1600 | |
| Stochastique (14,3,5): | 74.53 | |
| TEMA (21): | 36.21 | |
| Williams %R (14): | -39.02 | |
| Chande Momentum Oscillator (20): | 0.12 | |
| Repulse (5,40,3): | -0.1000 | |
| ROCnROLL: | 1 | |
| TRIX (15,9): | 0.0800 | |
| Courbe Coppock: | 2.11 |
| MA7: | 35.34 | |
| MA20: | 34.57 | |
| MA50: | 33.19 | |
| MA100: | 32.73 | |
| MAexp7: | 36.10 | |
| MAexp20: | 35.94 | |
| MAexp50: | 35.57 | |
| MAexp100: | 35.13 | |
| Price / MA7: | +2.01% | |
| Price / MA20: | +4.28% | |
| Price / MA50: | +8.62% | |
| Price / MA100: | +10.14% | |
| Price / MAexp7: | -0.14% | |
| Price / MAexp20: | +0.31% | |
| Price / MAexp50: | +1.35% | |
| Price / MAexp100: | +2.62% |
News
Don't forget to follow the news on AXA. At the time of publication of this analysis, the latest news was as follows:
- AXA celebrates 35th anniversary in Macau, presenting a series of engaging events for the public
- AXA Study: Hong Kong workers buckling under high stress and poor mind health
- AXA Launches Pioneering Heatwave Parametric Insurance
- AXA and Trip.com Strengthen Global Strategic Partnership with the Launch of "Trip.com Travel Smart"
- AXA's 'Week for Good 2024' Highlights Water and Climate Action
About author
Online


Add a comment
Comments
0 comments on the analysis AXA - 1H