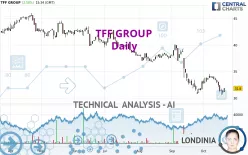
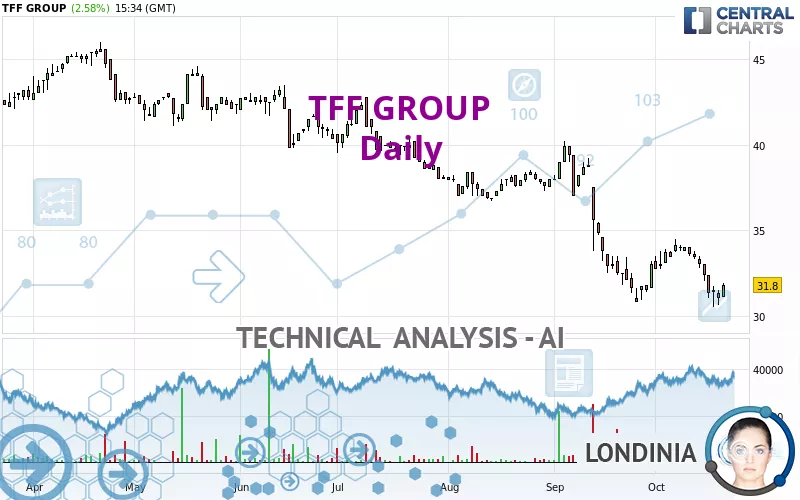
TFF GROUP - Daily - Technical analysis published on 10/21/2024 (GMT)
- 125
- 0
Click here for a new analysis!
- Timeframe : Daily
- - Analysis generated on
- Status : TARGET REACHED
Summary of the analysis

Additional analysis
Quotes
The TFF GROUP rating is 31.8 EUR. On the day, this instrument gained +2.58% and was between 31.1 EUR and 31.9 EUR. This implies that the price is at +2.25% from its lowest and at -0.31% from its highest.The Central Gaps scanner detects a bullish opening. A small advantage for buyers in the very short term.
Bullish opening
Type : Bullish
Timeframe : Openning
Here is a more detailed summary of the historical variations registered by TFF GROUP:
Near a new LOW record (1 year)
Type : Bearish
Timeframe : Weekly
Near a new LOW record (1st january)
Type : Bearish
Timeframe : Weekly
Near a new LOW record (1 month)
Type : Bearish
Timeframe : Weekly
Technical
A technical analysis in Daily of this TFF GROUP chart shows a sharp bearish trend. The signals given by moving averages are 92.86% bearish. This strong bearish trend is confirmed by the strong signals currently being given by short-term moving averages. The Central Indicators scanner does not detect any result on moving averages that would impact this trend.
On the 18 technical indicators analysed, 7 are bullish, 3 are neutral and 8 are bearish. But beware of excesses. The Central Indicators scanner currently detects this:
MACD indicator: bullish divergence
Type : Bullish
Timeframe : Daily
RSI indicator: bullish divergence
Type : Bullish
Timeframe : Daily
Pivot points : price is over resistance 1
Type : Neutral
Timeframe : Daily
Price is back over the pivot point
Type : Bullish
Timeframe : Weekly
Central Patterns, the market scanner focusing on chart patterns, resistances and supports found this result:
Near horizontal resistance
Type : Bearish
Timeframe : Daily
The Central Candlesticks scanner which studies Japanese candlesticks did not detect anything.
| S3 | S2 | S1 | Price | R1 | R2 | R3 | |
|---|---|---|---|---|---|---|---|
| ProTrendLines | 23.6 | 28.1 | 31.6 | 31.8 | 34.1 | 37.5 | 39.4 |
| Change (%) | -25.79% | -11.64% | -0.63% | - | +7.23% | +17.92% | +23.90% |
| Change | -8.2 | -3.7 | -0.2 | - | +2.3 | +5.7 | +7.6 |
| Level | Intermediate | Minor | Major | - | Minor | Intermediate | Intermediate |
Pivot points can also be used to set your price objectives. Here is the price situation in relation to pivot points:
| Pivot points | S3 | S2 | S1 | PP | R1 | R2 | R3 |
|---|---|---|---|---|---|---|---|
| Standard | 30.5 | 30.8 | 31.3 | 31.6 | 32.1 | 32.4 | 32.9 |
| Camarilla | 31.6 | 31.7 | 31.7 | 31.8 | 31.9 | 32.0 | 32.0 |
| Woodie | 30.6 | 30.9 | 31.4 | 31.7 | 32.2 | 32.5 | 33.0 |
| Fibonacci | 30.8 | 31.1 | 31.3 | 31.6 | 31.9 | 32.1 | 32.4 |
| Pivot points | S3 | S2 | S1 | PP | R1 | R2 | R3 |
|---|---|---|---|---|---|---|---|
| Standard | 26.8 | 28.7 | 29.8 | 31.7 | 32.8 | 34.7 | 35.8 |
| Camarilla | 30.2 | 30.5 | 30.7 | 31.0 | 31.3 | 31.6 | 31.8 |
| Woodie | 26.5 | 28.5 | 29.5 | 31.5 | 32.5 | 34.5 | 35.5 |
| Fibonacci | 28.7 | 29.8 | 30.5 | 31.7 | 32.8 | 33.5 | 34.7 |
| Pivot points | S3 | S2 | S1 | PP | R1 | R2 | R3 |
|---|---|---|---|---|---|---|---|
| Standard | 19.7 | 25.3 | 29.1 | 34.7 | 38.5 | 44.1 | 47.9 |
| Camarilla | 30.4 | 31.3 | 32.1 | 33.0 | 33.9 | 34.7 | 35.6 |
| Woodie | 18.9 | 24.9 | 28.3 | 34.3 | 37.7 | 43.7 | 47.1 |
| Fibonacci | 25.3 | 28.9 | 31.1 | 34.7 | 38.3 | 40.5 | 44.1 |
Numerical data
The following is the status of the technical indicators and moving averages at the time of publication of this technical analysis:
| RSI (14): | 39.10 | |
| MACD (12,26,9): | -0.9000 | |
| Directional Movement: | -17.5 | |
| AROON (14): | -57.1 | |
| DEMA (21): | 31.6 | |
| Parabolic SAR (0,02-0,02-0,2): | 33.9 | |
| Elder Ray (13): | -0.9 | |
| Super Trend (3,10): | 33.7 | |
| Zig ZAG (10): | 31.8 | |
| VORTEX (21): | 0.9000 | |
| Stochastique (14,3,5): | 22.50 | |
| TEMA (21): | 31.7 | |
| Williams %R (14): | -67.50 | |
| Chande Momentum Oscillator (20): | -1.9 | |
| Repulse (5,40,3): | 0.8000 | |
| ROCnROLL: | 2 | |
| TRIX (15,9): | -0.4000 | |
| Courbe Coppock: | 2.00 |
| MA7: | 32.0 | |
| MA20: | 32.6 | |
| MA50: | 35.1 | |
| MA100: | 37.7 | |
| MAexp7: | 32.0 | |
| MAexp20: | 32.9 | |
| MAexp50: | 34.7 | |
| MAexp100: | 36.9 | |
| Price / MA7: | -0.63% | |
| Price / MA20: | -2.45% | |
| Price / MA50: | -9.40% | |
| Price / MA100: | -15.65% | |
| Price / MAexp7: | -0.63% | |
| Price / MAexp20: | -3.34% | |
| Price / MAexp50: | -8.36% | |
| Price / MAexp100: | -13.82% |
News
Don't forget to follow the news on TFF GROUP. At the time of publication of this analysis, the latest news was as follows:
- TFF Pharmaceuticals Reports First Quarter 2021 Financial Results and Provides Business Update
- TFF Pharmaceuticals Awarded Contract under DARPA’s Next-Generation Personalized Protective Biosystems Program for U.S. Warfighters
- TFF Pharmaceuticals Prices Offering of Common Stock
- TFF Pharmaceuticals Reports Fourth Quarter and Full Year 2020 Financial and Business Results
- NeuroRX and TFF Pharmaceuticals Announce Entering Into Feasibility Collaboration
About author

Online


Add a comment
Comments
0 comments on the analysis TFF GROUP - Daily