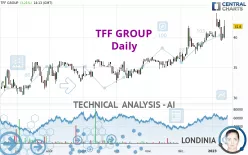
TFF GROUP - Daily - Technical analysis published on 01/12/2023 (GMT)
- 223
- 0
Click here for a new analysis!
- Timeframe : Daily
- - Analysis generated on
- Status : INVALID

Summary of the analysis

Additional analysis
Quotes
TFF GROUP rating 41.8 EUR. The price registered an increase of +3.21% on the session with the lowest point at 39.8 EUR and the highest point at 42.8 EUR. The deviation from the price is +5.03% for the low point and -2.34% for the high point.The Central Gaps scanner detects a bearish opening marking the presence of sellers ahead of buyers at the opening but not sufficiently marked to allow the price to register a quotation gap.
Bearish opening
Type : Bearish
Timeframe : Openning
Here is a more detailed summary of the historical variations registered by TFF GROUP:
Near a new HIGH record (5 years)
Type : Bullish
Timeframe : Weekly
Near a new HIGH record (1 year)
Type : Bullish
Timeframe : Weekly
Near a new HIGH record (1st january)
Type : Bullish
Timeframe : Weekly
Near a new HIGH record (1 month)
Type : Bullish
Timeframe : Weekly
Technical
Technical analysis of TFF GROUP in Daily shows a strongly overall bullish trend. 92.86% of the signals given by moving averages are bullish. The overall trend is supported by the strong bullish signals from short-term moving averages. The Central Indicators market scanner currently does not detect any result that concerns moving averages.
In fact, according to the parameters integrated into the Central Analyzer system, 12 technical indicators out of 18 analysed are currently bullish. Central Indicators, the detector scanner for these technical indicators has recently detected several signals:
Pivot points : price is over resistance 2
Type : Neutral
Timeframe : Daily
Price is back under the pivot point
Type : Bearish
Timeframe : Weekly
Williams %R indicator is back over -50
Type : Bullish
Timeframe : Daily
Central Patterns, the market scanner focusing on chart patterns, resistances and supports found these results:
Near horizontal resistance
Type : Bearish
Timeframe : Daily
Near support of channel
Type : Bullish
Timeframe : Daily
The Central Candlesticks scanner, specialised in Japanese candlesticks, did not identify any signals.
| S3 | S2 | S1 | Price | R1 | |
|---|---|---|---|---|---|
| ProTrendLines | 36.9 | 40.1 | 41.4 | 41.8 | 46.1 |
| Change (%) | -11.72% | -4.07% | -0.96% | - | +10.29% |
| Change | -4.9 | -1.7 | -0.4 | - | +4.3 |
| Level | Minor | Minor | Major | - | Major |
To determine price objectives, it is also possible to use the pivot points. Here is the price position in relation to pivot points:
| Pivot points | S3 | S2 | S1 | PP | R1 | R2 | R3 |
|---|---|---|---|---|---|---|---|
| Standard | 38.9 | 39.2 | 39.9 | 40.2 | 40.9 | 41.2 | 41.9 |
| Camarilla | 40.2 | 40.3 | 40.4 | 40.5 | 40.6 | 40.7 | 40.8 |
| Woodie | 39.0 | 39.3 | 40.0 | 40.3 | 41.0 | 41.3 | 42.0 |
| Fibonacci | 39.2 | 39.6 | 39.9 | 40.2 | 40.6 | 40.9 | 41.2 |
| Pivot points | S3 | S2 | S1 | PP | R1 | R2 | R3 |
|---|---|---|---|---|---|---|---|
| Standard | 36.3 | 38.2 | 40.3 | 42.2 | 44.3 | 46.2 | 48.3 |
| Camarilla | 41.4 | 41.8 | 42.1 | 42.5 | 42.9 | 43.2 | 43.6 |
| Woodie | 36.5 | 38.3 | 40.5 | 42.3 | 44.5 | 46.3 | 48.5 |
| Fibonacci | 38.2 | 39.7 | 40.6 | 42.2 | 43.7 | 44.6 | 46.2 |
| Pivot points | S3 | S2 | S1 | PP | R1 | R2 | R3 |
|---|---|---|---|---|---|---|---|
| Standard | 31.3 | 33.6 | 37.2 | 39.5 | 43.1 | 45.4 | 49.0 |
| Camarilla | 39.1 | 39.6 | 40.2 | 40.7 | 41.2 | 41.8 | 42.3 |
| Woodie | 31.9 | 33.9 | 37.8 | 39.8 | 43.7 | 45.7 | 49.6 |
| Fibonacci | 33.6 | 35.9 | 37.3 | 39.5 | 41.8 | 43.2 | 45.4 |
Numerical data
The following is the status of technical indicators and moving averages registered at the time this technical analysis was created:
| RSI (14): | 60.40 | |
| MACD (12,26,9): | 1.0000 | |
| Directional Movement: | 24.6 | |
| AROON (14): | 64.3 | |
| DEMA (21): | 41.5 | |
| Parabolic SAR (0,02-0,02-0,2): | 38.5 | |
| Elder Ray (13): | 0.6 | |
| Super Trend (3,10): | 39.5 | |
| Zig ZAG (10): | 41.8 | |
| VORTEX (21): | 1.0000 | |
| Stochastique (14,3,5): | 35.50 | |
| TEMA (21): | 41.6 | |
| Williams %R (14): | -45.80 | |
| Chande Momentum Oscillator (20): | 2.3 | |
| Repulse (5,40,3): | 1.9000 | |
| ROCnROLL: | 1 | |
| TRIX (15,9): | 0.4000 | |
| Courbe Coppock: | 10.60 |
| MA7: | 41.3 | |
| MA20: | 40.1 | |
| MA50: | 38.0 | |
| MA100: | 36.1 | |
| MAexp7: | 41.0 | |
| MAexp20: | 40.2 | |
| MAexp50: | 38.5 | |
| MAexp100: | 36.7 | |
| Price / MA7: | +1.21% | |
| Price / MA20: | +4.24% | |
| Price / MA50: | +10.00% | |
| Price / MA100: | +15.79% | |
| Price / MAexp7: | +1.95% | |
| Price / MAexp20: | +3.98% | |
| Price / MAexp50: | +8.57% | |
| Price / MAexp100: | +13.90% |
News
The last news published on TFF GROUP at the time of the generation of this analysis was as follows:
- TFF Pharmaceuticals Reports First Quarter 2021 Financial Results and Provides Business Update
- TFF Pharmaceuticals Awarded Contract under DARPA’s Next-Generation Personalized Protective Biosystems Program for U.S. Warfighters
- TFF Pharmaceuticals Prices Offering of Common Stock
- TFF Pharmaceuticals Reports Fourth Quarter and Full Year 2020 Financial and Business Results
- NeuroRX and TFF Pharmaceuticals Announce Entering Into Feasibility Collaboration
About author
Online


Add a comment
Comments
0 comments on the analysis TFF GROUP - Daily