TESCO ORD 6 1/3P - Daily - Technical analysis published on 11/04/2019 (GMT)
- 319
- 0
- Who voted?
Click here for a new analysis!
- Timeframe : Daily
- - Analysis generated on
- Status : TARGET REACHED
Summary of the analysis

Additional analysis
Quotes
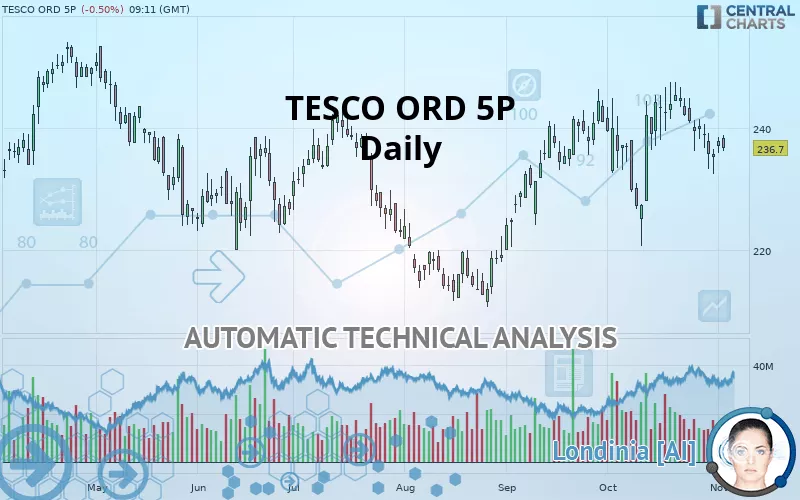
TESCO ORD 5P rating 236.7 GBX. The price registered a decrease of -0.50% on the session and was between 236.2 GBX and 238.8 GBX. This implies that the price is at +0.21% from its lowest and at -0.88% from its highest.A study of price movements over other periods shows the following variations:
Near a new HIGH record (1 year)
Type : Bullish
Timeframe : Weekly
Near a new HIGH record (1st january)
Type : Bullish
Timeframe : Weekly
Near a new HIGH record (1 month)
Type : Bullish
Timeframe : Weekly
Technical
Technical analysis of TESCO ORD 5P in Daily shows an overall bullish trend. The signals given by moving averages are 75% bullish. This bullish trend could slow down given the neutral signals currently being given by short-term moving averages. The Central Indicators market scanner is currently detecting a bullish signal that could impact this trend:
Bullish price crossover with adaptative moving average 20
Type : Bullish
Timeframe : Daily
In fact, only 8 technical indicators out of 18 studied are currently positioned bearish. Caution: the Central Indicators scanner currently detects an excess:
MACD indicator: bullish divergence
Type : Bullish
Timeframe : Daily
RSI indicator: bullish divergence
Type : Bullish
Timeframe : Daily
RSI indicator is back over 50
Type : Bullish
Timeframe : Daily
Price is back over the pivot point
Type : Bullish
Timeframe : Daily
Central Patterns, the market scanner focusing on chart patterns, resistances and supports found these results:
Near horizontal support
Type : Bullish
Timeframe : Daily
Support of channel is broken
Type : Bearish
Timeframe : Daily
No result was found by the Central Candlesticks scanner on Japanese candlesticks.
| S3 | S2 | S1 | Price | R1 | R2 | R3 | |
|---|---|---|---|---|---|---|---|
| ProTrendLines | 212.7 | 218.7 | 227.3 | 236.7 | 236.8 | 242.1 | 245.5 |
| Change (%) | -10.14% | -7.60% | -3.97% | - | +0.04% | +2.28% | +3.72% |
| Change | -24.0 | -18.0 | -9.4 | - | +0.1 | +5.4 | +8.8 |
| Level | Intermediate | Major | Major | - | Major | Intermediate | Major |
To determine price objectives, it is also possible to use the pivot points. Here is the price position in relation to pivot points:
| Pivot points | S3 | S2 | S1 | PP | R1 | R2 | R3 |
|---|---|---|---|---|---|---|---|
| Standard | 233.8 | 234.8 | 236.4 | 237.4 | 239.0 | 240.0 | 241.6 |
| Camarilla | 237.2 | 237.4 | 237.7 | 237.9 | 238.1 | 238.4 | 238.6 |
| Woodie | 234.0 | 235.0 | 236.6 | 237.6 | 239.2 | 240.2 | 241.8 |
| Fibonacci | 234.8 | 235.8 | 236.4 | 237.4 | 238.4 | 239.0 | 240.0 |
| Pivot points | S3 | S2 | S1 | PP | R1 | R2 | R3 |
|---|---|---|---|---|---|---|---|
| Standard | 224.1 | 228.3 | 233.1 | 237.3 | 242.1 | 246.3 | 251.1 |
| Camarilla | 235.4 | 236.3 | 237.1 | 237.9 | 238.7 | 239.6 | 240.4 |
| Woodie | 224.4 | 228.5 | 233.4 | 237.5 | 242.4 | 246.5 | 251.4 |
| Fibonacci | 228.3 | 231.7 | 233.9 | 237.3 | 240.7 | 242.9 | 246.3 |
| Pivot points | S3 | S2 | S1 | PP | R1 | R2 | R3 |
|---|---|---|---|---|---|---|---|
| Standard | 194.5 | 207.6 | 221.4 | 234.5 | 248.3 | 261.4 | 275.2 |
| Camarilla | 227.8 | 230.3 | 232.7 | 235.2 | 237.7 | 240.1 | 242.6 |
| Woodie | 194.9 | 207.8 | 221.8 | 234.7 | 248.7 | 261.6 | 275.6 |
| Fibonacci | 207.6 | 217.9 | 224.2 | 234.5 | 244.8 | 251.1 | 261.4 |
Numerical data
The following are the details of the technical indicators and moving averages that were collected to generate this technical analysis:
| RSI (14): | 50.50 | |
| MACD (12,26,9): | 1.0000 | |
| Directional Movement: | -3.8 | |
| AROON (14): | -57.1 | |
| DEMA (21): | 240.2 | |
| Parabolic SAR (0,02-0,02-0,2): | 246.2 | |
| Elder Ray (13): | -0.4 | |
| Super Trend (3,10): | 226.8 | |
| Zig ZAG (10): | 237.7 | |
| VORTEX (21): | 1.0000 | |
| Stochastique (14,3,5): | 29.40 | |
| TEMA (21): | 238.7 | |
| Williams %R (14): | -65.60 | |
| Chande Momentum Oscillator (20): | -4.9 | |
| Repulse (5,40,3): | -0.4000 | |
| ROCnROLL: | -1 | |
| TRIX (15,9): | 0.1000 | |
| Courbe Coppock: | 0.50 |
| MA7: | 237.8 | |
| MA20: | 238.6 | |
| MA50: | 233.8 | |
| MA100: | 229.2 | |
| MAexp7: | 238.1 | |
| MAexp20: | 238.2 | |
| MAexp50: | 234.6 | |
| MAexp100: | 231.1 | |
| Price / MA7: | -0.46% | |
| Price / MA20: | -0.80% | |
| Price / MA50: | +1.24% | |
| Price / MA100: | +3.27% | |
| Price / MAexp7: | -0.59% | |
| Price / MAexp20: | -0.63% | |
| Price / MAexp50: | +0.90% | |
| Price / MAexp100: | +2.42% |
News
The last news published on TESCO ORD 5P at the time of the generation of this analysis was as follows:
-
 US non-farm payrolls report, PMIs, RBA rate meeting and Tesco - 28 September 2019
-
The brief: Gender balance makes steady progress, Tesco warns against no-deal Brexit
-
US-China trade war outlook, China trade, UK wages, Tesco Q1 update – 8 June 2019
-
Tesco checks out of its mortgage business
-
Tesco share price | What to expect from annual results
About author

Online


Add a comment
Comments
0 comments on the analysis TESCO ORD 6 1/3P - Daily