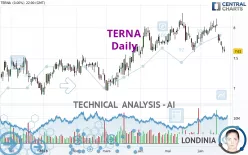
TERNA - Daily - Technical analysis published on 06/26/2023 (GMT)
- 136
- 0
- Timeframe : Daily
- - Analysis generated on
- Status : NEUTRAL

Summary of the analysis

Additional analysis
Quotes
The TERNA rating is 7.600 EUR. On the day, this instrument lost -0.13% with the lowest point at 7.556 EUR and the highest point at 7.652 EUR. The deviation from the price is +0.58% for the low point and -0.68% for the high point.The Central Gaps scanner detects a bullish opening. A small advantage for buyers in the very short term.
Bullish opening
Type : Bullish
Timeframe : Openning
Here is a more detailed summary of the historical variations registered by TERNA:
Near a new HIGH record (5 years)
Type : Bullish
Timeframe : Weekly
Near a new HIGH record (1 year)
Type : Bullish
Timeframe : Weekly
Near a new HIGH record (1st january)
Type : Bullish
Timeframe : Weekly
Near a new HIGH record (1 month)
Type : Bullish
Timeframe : Weekly
Technical
Technical analysis of this Daily chart of TERNA indicates that the overall trend is slightly bullish. 60.71% of the signals given by moving averages are bullish. Caution: the slightly bearish signals currently given by short-term moving averages indicate that this slightly bullish trend could be reversed. The Central Indicators market scanner currently does not detect any result that concerns moving averages.
In fact, only 9 technical indicators out of 18 studied are currently bearish. But beware of excesses. The Central Indicators scanner currently detects this:
CCI indicator is oversold : under -100
Type : Neutral
Timeframe : Daily
Williams %R indicator is oversold : under -80
Type : Neutral
Timeframe : Daily
Price is back under the pivot point
Type : Bearish
Timeframe : Daily
Central Patterns, the market scanner focusing on chart patterns, resistances and supports found this result:
Support of channel is broken
Type : Bearish
Timeframe : Daily
The Central Candlesticks scanner which studies Japanese candlesticks did not detect anything.
| S3 | S2 | S1 | Price | R1 | |
|---|---|---|---|---|---|
| ProTrendLines | 6.760 | 7.061 | 7.267 | 7.600 | 7.790 |
| Change (%) | -11.05% | -7.09% | -4.38% | - | +2.50% |
| Change | -0.840 | -0.539 | -0.333 | - | +0.190 |
| Level | Intermediate | Minor | Major | - | Major |
Pivot points can also be used to set your price objectives. Here is the price situation in relation to pivot points:
| Pivot points | S3 | S2 | S1 | PP | R1 | R2 | R3 |
|---|---|---|---|---|---|---|---|
| Standard | 7.470 | 7.530 | 7.570 | 7.630 | 7.670 | 7.730 | 7.770 |
| Camarilla | 7.583 | 7.592 | 7.601 | 7.610 | 7.619 | 7.628 | 7.638 |
| Woodie | 7.460 | 7.525 | 7.560 | 7.625 | 7.660 | 7.725 | 7.760 |
| Fibonacci | 7.530 | 7.568 | 7.592 | 7.630 | 7.668 | 7.692 | 7.730 |
| Pivot points | S3 | S2 | S1 | PP | R1 | R2 | R3 |
|---|---|---|---|---|---|---|---|
| Standard | 7.199 | 7.393 | 7.501 | 7.695 | 7.803 | 7.997 | 8.105 |
| Camarilla | 7.527 | 7.555 | 7.582 | 7.610 | 7.638 | 7.665 | 7.693 |
| Woodie | 7.157 | 7.372 | 7.459 | 7.674 | 7.761 | 7.976 | 8.063 |
| Fibonacci | 7.393 | 7.508 | 7.579 | 7.695 | 7.810 | 7.881 | 7.997 |
| Pivot points | S3 | S2 | S1 | PP | R1 | R2 | R3 |
|---|---|---|---|---|---|---|---|
| Standard | 6.708 | 7.052 | 7.341 | 7.685 | 7.974 | 8.318 | 8.607 |
| Camarilla | 7.455 | 7.513 | 7.571 | 7.629 | 7.687 | 7.745 | 7.803 |
| Woodie | 6.680 | 7.038 | 7.313 | 7.671 | 7.946 | 8.304 | 8.579 |
| Fibonacci | 7.052 | 7.294 | 7.444 | 7.685 | 7.927 | 8.077 | 8.318 |
Numerical data
The following is the status of technical indicators and moving averages registered at the time this technical analysis was created:
| RSI (14): | 41.48 | |
| MACD (12,26,9): | 0.0040 | |
| Directional Movement: | -5.925 | |
| AROON (14): | -42.857 | |
| DEMA (21): | 7.728 | |
| Parabolic SAR (0,02-0,02-0,2): | 7.926 | |
| Elder Ray (13): | -0.105 | |
| Super Trend (3,10): | 7.895 | |
| Zig ZAG (10): | 7.606 | |
| VORTEX (21): | 1.0660 | |
| Stochastique (14,3,5): | 12.06 | |
| TEMA (21): | 7.692 | |
| Williams %R (14): | -86.98 | |
| Chande Momentum Oscillator (20): | -0.138 | |
| Repulse (5,40,3): | -1.6190 | |
| ROCnROLL: | 2 | |
| TRIX (15,9): | 0.0510 | |
| Courbe Coppock: | 0.36 |
| MA7: | 7.714 | |
| MA20: | 7.730 | |
| MA50: | 7.678 | |
| MA100: | 7.445 | |
| MAexp7: | 7.682 | |
| MAexp20: | 7.711 | |
| MAexp50: | 7.641 | |
| MAexp100: | 7.492 | |
| Price / MA7: | -1.48% | |
| Price / MA20: | -1.68% | |
| Price / MA50: | -1.02% | |
| Price / MA100: | +2.08% | |
| Price / MAexp7: | -1.07% | |
| Price / MAexp20: | -1.44% | |
| Price / MAexp50: | -0.54% | |
| Price / MAexp100: | +1.44% |
News
The last news published on TERNA at the time of the generation of this analysis was as follows:
About author
Online


Add a comment
Comments
0 comments on the analysis TERNA - Daily