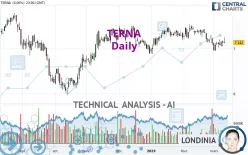
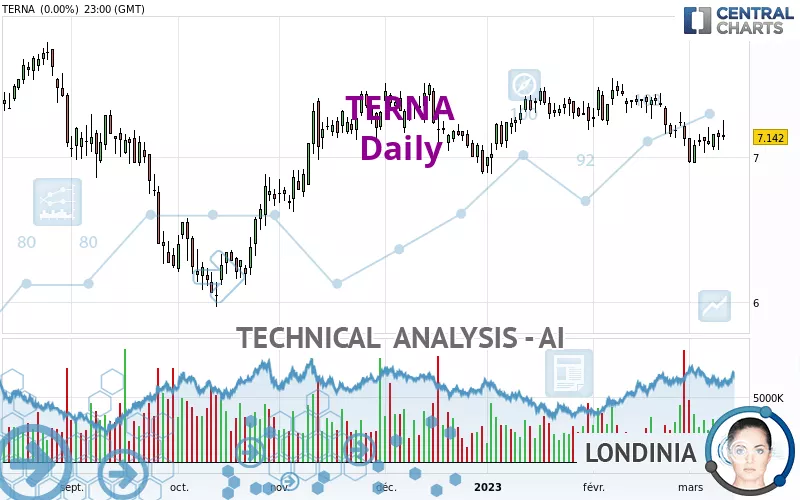
TERNA - Daily - Technical analysis published on 03/10/2023 (GMT)
- 155
- 0
Click here for a new analysis!
- Timeframe : Daily
- - Analysis generated on
- Status : INVALID
Summary of the analysis

Additional analysis
Quotes
TERNA rating 7.140 EUR. On the day, this instrument lost -0.03% with the lowest point at 7.120 EUR and the highest point at 7.258 EUR. The deviation from the price is +0.28% for the low point and -1.63% for the high point.Here is a more detailed summary of the historical variations registered by TERNA:
Near a new HIGH record (1st january)
Type : Bullish
Timeframe : Weekly
Near a new HIGH record (1 month)
Type : Bullish
Timeframe : Weekly
Technical
Technical analysis of this Daily chart of TERNA indicates that the overall trend is bearish. The signals given by moving averages are 64.29% bearish. This bearish trend is reinforced by the strong signals currently being given by short-term moving averages. The Central Indicators market scanner currently does not detect any result that concerns moving averages.
The technical indicators are generally neutral. They do not provide relevant information on the direction of future price movements.
The Central Indicators scanner found this result concerning these indicators:
Parabolic SAR indicator bullish reversal
Type : Bullish
Timeframe : Daily
Central Patterns, the market scanner focusing on chart patterns, resistances and supports found these results:
Near horizontal resistance
Type : Bearish
Timeframe : Daily
Near support of triangle
Type : Bullish
Timeframe : Daily
Central Candlesticks, the scanner specialised in Japanese candlesticks, detects these signals that could have an impact on the current short-term trend:
Bullish harami
Type : Bullish
Timeframe : Daily
Doji
Type : Neutral
Timeframe : Daily
| S3 | S2 | S1 | Price | R1 | R2 | R3 | |
|---|---|---|---|---|---|---|---|
| ProTrendLines | 6.686 | 6.895 | 7.029 | 7.140 | 7.249 | 7.490 | 7.720 |
| Change (%) | -6.36% | -3.43% | -1.55% | - | +1.53% | +4.90% | +8.12% |
| Change | -0.454 | -0.245 | -0.111 | - | +0.109 | +0.350 | +0.580 |
| Level | Minor | Intermediate | Major | - | Intermediate | Major | Minor |
To determine price objectives, it is also possible to use the pivot points. Here is the price position in relation to pivot points:
| Pivot points | S3 | S2 | S1 | PP | R1 | R2 | R3 |
|---|---|---|---|---|---|---|---|
| Standard | 6.918 | 6.982 | 7.062 | 7.126 | 7.206 | 7.270 | 7.350 |
| Camarilla | 7.102 | 7.116 | 7.129 | 7.142 | 7.155 | 7.168 | 7.182 |
| Woodie | 6.926 | 6.986 | 7.070 | 7.130 | 7.214 | 7.274 | 7.358 |
| Fibonacci | 6.982 | 7.037 | 7.071 | 7.126 | 7.181 | 7.215 | 7.270 |
| Pivot points | S3 | S2 | S1 | PP | R1 | R2 | R3 |
|---|---|---|---|---|---|---|---|
| Standard | 6.584 | 6.772 | 6.938 | 7.126 | 7.292 | 7.480 | 7.646 |
| Camarilla | 7.007 | 7.039 | 7.072 | 7.104 | 7.137 | 7.169 | 7.201 |
| Woodie | 6.573 | 6.767 | 6.927 | 7.121 | 7.281 | 7.475 | 7.635 |
| Fibonacci | 6.772 | 6.907 | 6.991 | 7.126 | 7.261 | 7.345 | 7.480 |
| Pivot points | S3 | S2 | S1 | PP | R1 | R2 | R3 |
|---|---|---|---|---|---|---|---|
| Standard | 6.488 | 6.784 | 6.956 | 7.252 | 7.424 | 7.720 | 7.892 |
| Camarilla | 6.999 | 7.042 | 7.085 | 7.128 | 7.171 | 7.214 | 7.257 |
| Woodie | 6.426 | 6.753 | 6.894 | 7.221 | 7.362 | 7.689 | 7.830 |
| Fibonacci | 6.784 | 6.963 | 7.073 | 7.252 | 7.431 | 7.541 | 7.720 |
Numerical data
The following are the details of the technical indicators and moving averages that were collected to generate this technical analysis:
| RSI (14): | 45.82 | |
| MACD (12,26,9): | -0.0530 | |
| Directional Movement: | -4.335 | |
| AROON (14): | -42.857 | |
| DEMA (21): | 7.131 | |
| Parabolic SAR (0,02-0,02-0,2): | 6.960 | |
| Elder Ray (13): | 0.024 | |
| Super Trend (3,10): | 7.431 | |
| Zig ZAG (10): | 7.160 | |
| VORTEX (21): | 0.8590 | |
| Stochastique (14,3,5): | 40.56 | |
| TEMA (21): | 7.086 | |
| Williams %R (14): | -58.33 | |
| Chande Momentum Oscillator (20): | -0.060 | |
| Repulse (5,40,3): | 0.2520 | |
| ROCnROLL: | 2 | |
| TRIX (15,9): | -0.0980 | |
| Courbe Coppock: | 6.15 |
| MA7: | 7.125 | |
| MA20: | 7.223 | |
| MA50: | 7.273 | |
| MA100: | 7.184 | |
| MAexp7: | 7.141 | |
| MAexp20: | 7.195 | |
| MAexp50: | 7.228 | |
| MAexp100: | 7.202 | |
| Price / MA7: | +0.21% | |
| Price / MA20: | -1.15% | |
| Price / MA50: | -1.83% | |
| Price / MA100: | -0.61% | |
| Price / MAexp7: | -0.01% | |
| Price / MAexp20: | -0.76% | |
| Price / MAexp50: | -1.22% | |
| Price / MAexp100: | -0.86% |
News
The last news published on TERNA at the time of the generation of this analysis was as follows:
About author
Online


Add a comment
Comments
0 comments on the analysis TERNA - Daily