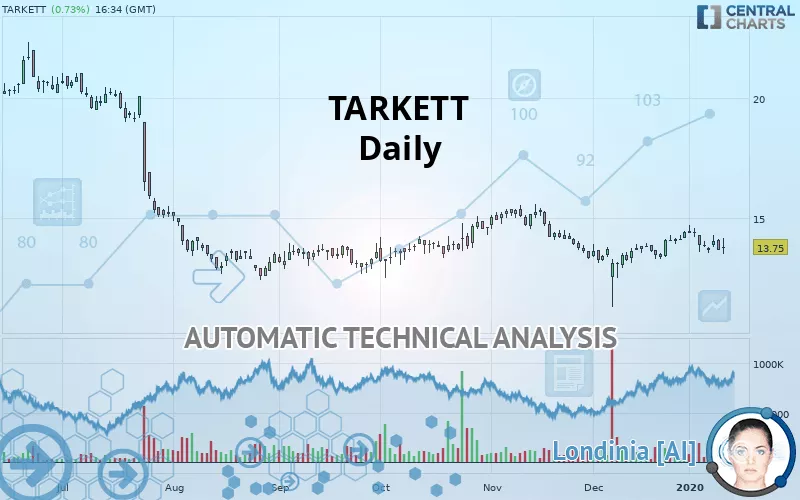
TARKETT - Daily - Technical analysis published on 01/13/2020 (GMT)
- 400
- 0
- Who voted?
Click here for a new analysis!
- Timeframe : Daily
- - Analysis generated on
- Status : TARGET REACHED
Summary of the analysis

Additional analysis
Quotes
The TARKETT price is 13.75 EUR. The price registered an increase of +0.73% on the session and was between 13.47 EUR and 14.16 EUR. This implies that the price is at +2.08% from its lowest and at -2.90% from its highest.The Central Gaps scanner detects a bullish opening. A small advantage for buyers in the very short term.
Bullish opening
Type : Bullish
Timeframe : Openning
Here is a more detailed summary of the historical variations registered by TARKETT:
Near a new HIGH record (1st january)
Type : Bullish
Timeframe : Weekly
Near a new HIGH record (1 month)
Type : Bullish
Timeframe : Weekly
Technical
Technical analysis of this Daily chart of TARKETT indicates that the overall trend is bearish. The signals given by moving averages are at 71.43% bearish. This bearish trend shows slight signs of slowing down given the slightly bearish signals of short-term moving averages. The Central Indicators scanner detects bearish signals on moving averages that could impact this trend:
Bearish price crossover with Moving Average 20
Type : Bearish
Timeframe : Daily
Bearish price crossover with Moving Average 100
Type : Bearish
Timeframe : Daily
Bearish price crossover with adaptative moving average 20
Type : Bearish
Timeframe : Daily
Bearish price crossover with adaptative moving average 50
Type : Bearish
Timeframe : Daily
An assessment of technical indicators does not currently provide any relevant information to suggest whether the signal given by the technical indicators is more bullish or bearish.
Caution: the Central Indicators scanner currently detects an excess:
MACD indicator: bearish divergence
Type : Bearish
Timeframe : Daily
RSI indicator is back under 50
Type : Bearish
Timeframe : Daily
MACD crosses DOWN its Moving Average
Type : Bearish
Timeframe : Daily
Ichimoku : price is under the cloud
Type : Bearish
Timeframe : Daily
Price is back under the pivot point
Type : Bearish
Timeframe : Daily
Price is back under the pivot point
Type : Bearish
Timeframe : Weekly
Williams %R indicator is back under -50
Type : Bearish
Timeframe : Daily
No signals are given by Central Patterns, a market scanner specialised in chart patterns, resistances and supports.
The presence of a bearish pattern in Japanese candlesticks detected by Central Candlesticks that could cause a correction in the very short term was also detected:
Bearish engulfing lines
Type : Bearish
Timeframe : Daily
| S2 | S1 | Price | R1 | R2 | R3 | |
|---|---|---|---|---|---|---|
| ProTrendLines | 12.64 | 13.39 | 13.75 | 15.31 | 18.39 | 21.70 |
| Change (%) | -8.07% | -2.62% | - | +11.35% | +33.75% | +57.82% |
| Change | -1.11 | -0.36 | - | +1.56 | +4.64 | +7.95 |
| Level | Major | Major | - | Intermediate | Minor | Intermediate |
Attention could also be paid to pivot points to set price objectives:
| Pivot points | S3 | S2 | S1 | PP | R1 | R2 | R3 |
|---|---|---|---|---|---|---|---|
| Standard | 13.06 | 13.36 | 13.50 | 13.80 | 13.94 | 14.24 | 14.38 |
| Camarilla | 13.53 | 13.57 | 13.61 | 13.65 | 13.69 | 13.73 | 13.77 |
| Woodie | 12.99 | 13.32 | 13.43 | 13.76 | 13.87 | 14.20 | 14.31 |
| Fibonacci | 13.36 | 13.53 | 13.63 | 13.80 | 13.97 | 14.07 | 14.24 |
| Pivot points | S3 | S2 | S1 | PP | R1 | R2 | R3 |
|---|---|---|---|---|---|---|---|
| Standard | 12.58 | 13.04 | 13.35 | 13.81 | 14.12 | 14.58 | 14.89 |
| Camarilla | 13.44 | 13.51 | 13.58 | 13.65 | 13.72 | 13.79 | 13.86 |
| Woodie | 12.50 | 13.00 | 13.27 | 13.77 | 14.04 | 14.54 | 14.81 |
| Fibonacci | 13.04 | 13.34 | 13.52 | 13.81 | 14.11 | 14.29 | 14.58 |
| Pivot points | S3 | S2 | S1 | PP | R1 | R2 | R3 |
|---|---|---|---|---|---|---|---|
| Standard | 9.12 | 10.19 | 12.29 | 13.36 | 15.46 | 16.53 | 18.63 |
| Camarilla | 13.53 | 13.82 | 14.11 | 14.40 | 14.69 | 14.98 | 15.27 |
| Woodie | 9.65 | 10.45 | 12.82 | 13.62 | 15.99 | 16.79 | 19.16 |
| Fibonacci | 10.19 | 11.40 | 12.15 | 13.36 | 14.57 | 15.32 | 16.53 |
Numerical data
The following are the details of the technical indicators and moving averages that were collected to generate this technical analysis:
| RSI (14): | 47.51 | |
| MACD (12,26,9): | 0.0000 | |
| Directional Movement: | -8.10 | |
| AROON (14): | 50.00 | |
| DEMA (21): | 13.86 | |
| Parabolic SAR (0,02-0,02-0,2): | 14.50 | |
| Elder Ray (13): | -0.07 | |
| Super Trend (3,10): | 13.30 | |
| Zig ZAG (10): | 13.75 | |
| VORTEX (21): | 1.0400 | |
| Stochastique (14,3,5): | 38.85 | |
| TEMA (21): | 13.92 | |
| Williams %R (14): | -65.71 | |
| Chande Momentum Oscillator (20): | -0.31 | |
| Repulse (5,40,3): | -2.8800 | |
| ROCnROLL: | 2 | |
| TRIX (15,9): | 0.0100 | |
| Courbe Coppock: | 3.89 |
| MA7: | 13.89 | |
| MA20: | 13.87 | |
| MA50: | 14.10 | |
| MA100: | 13.83 | |
| MAexp7: | 13.85 | |
| MAexp20: | 13.88 | |
| MAexp50: | 13.96 | |
| MAexp100: | 14.40 | |
| Price / MA7: | -1.01% | |
| Price / MA20: | -0.87% | |
| Price / MA50: | -2.48% | |
| Price / MA100: | -0.58% | |
| Price / MAexp7: | -0.72% | |
| Price / MAexp20: | -0.94% | |
| Price / MAexp50: | -1.50% | |
| Price / MAexp100: | -4.51% |
News
Don"t forget to follow the news on TARKETT. At the time of publication of this analysis, the latest news was as follows:
- Information on the total number of voting rights and shares in Tarkett’s share capital as of December 31, 2019
- Update on Q4 trading in North America - 2019 outlook revised
- Information on the total number of voting rights and shares in Tarkett’s share capital as of September 30, 2019
- Déclaration des opérations d’achats d’action réalisées dans les conditions de l’article 5 §2 du règlement (UE) n°596/2014 du 16 avril 2014 sur les abus de marché
- Déclaration des opérations d’achats d’action réalisées dans les conditions de l’article 5 §2 du règlement (UE) n°596/2014 du 16 avril 2014 sur les abus de marché
About author

Online


Add a comment
Comments
0 comments on the analysis TARKETT - Daily