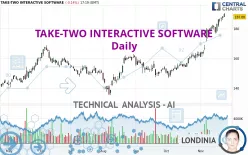
TAKE-TWO INTERACTIVE SOFTWARE - Daily - Technical analysis published on 11/25/2024 (GMT)
- 143
- 0
Click here for a new analysis!
- Timeframe : Daily
- - Analysis generated on
- Status : LEVEL MAINTAINED

Summary of the analysis

Additional analysis
Quotes
The TAKE-TWO INTERACTIVE SOFTWARE rating is 187.88 USD. On the day, this instrument lost -0.14% with the lowest point at 187.71 USD and the highest point at 190.43 USD. The deviation from the price is +0.09% for the low point and -1.34% for the high point.The Central Gaps scanner detects the formation of a bullish gap marking the strong presence of buyers against sellers at the opening. This formed a quotation gap.
Opening Gap UP
Type : Bullish
Timeframe : Openning
So that you have an overall view of the price change, here is a table showing the variations over several periods:
New HIGH record (1 year)
Type : Bullish
Timeframe : Weekly
New HIGH record (1st january)
Type : Bullish
Timeframe : Weekly
New HIGH record (1 month)
Type : Bullish
Timeframe : Weekly
Technical
A technical analysis in Daily of this TAKE-TWO INTERACTIVE SOFTWARE chart shows a strongly bullish trend. The signals given by the moving averages are 92.86% bullish. This strong bullish trend is confirmed by the strong signals currently being given by short-term moving averages. The Central Indicators scanner does not detect any result on moving averages that would impact this trend.
Technical indicators are strongly bullish, suggesting that the price increase should continue.
Caution: the Central Indicators scanner currently detects an excess:
RSI indicator is overbought : over 70
Type : Neutral
Timeframe : Daily
CCI indicator is overbought : over 100
Type : Neutral
Timeframe : Daily
Williams %R indicator is overbought : over -20
Type : Neutral
Timeframe : Daily
Central Patterns, the market scanner focusing on chart patterns, resistances and supports found this result:
Near horizontal resistance
Type : Bearish
Timeframe : Daily
No result was found by the Central Candlesticks scanner on Japanese candlesticks.
| S3 | S2 | S1 | Price | R1 | R2 | |
|---|---|---|---|---|---|---|
| ProTrendLines | 147.66 | 154.76 | 168.15 | 187.88 | 192.91 | 213.34 |
| Change (%) | -21.41% | -17.63% | -10.50% | - | +2.68% | +13.55% |
| Change | -40.22 | -33.12 | -19.73 | - | +5.03 | +25.46 |
| Level | Minor | Major | Major | - | Intermediate | Major |
To determine price objectives, it is also possible to use the pivot points. Here is the price position in relation to pivot points:
| Pivot points | S3 | S2 | S1 | PP | R1 | R2 | R3 |
|---|---|---|---|---|---|---|---|
| Standard | 183.95 | 184.91 | 186.53 | 187.49 | 189.11 | 190.07 | 191.69 |
| Camarilla | 187.44 | 187.68 | 187.91 | 188.15 | 188.39 | 188.62 | 188.86 |
| Woodie | 184.28 | 185.08 | 186.86 | 187.66 | 189.44 | 190.24 | 192.02 |
| Fibonacci | 184.91 | 185.90 | 186.50 | 187.49 | 188.48 | 189.08 | 190.07 |
| Pivot points | S3 | S2 | S1 | PP | R1 | R2 | R3 |
|---|---|---|---|---|---|---|---|
| Standard | 169.32 | 173.20 | 180.68 | 184.56 | 192.04 | 195.92 | 203.40 |
| Camarilla | 185.03 | 186.07 | 187.11 | 188.15 | 189.19 | 190.23 | 191.27 |
| Woodie | 171.11 | 174.10 | 182.47 | 185.46 | 193.83 | 196.82 | 205.19 |
| Fibonacci | 173.20 | 177.54 | 180.22 | 184.56 | 188.90 | 191.58 | 195.92 |
| Pivot points | S3 | S2 | S1 | PP | R1 | R2 | R3 |
|---|---|---|---|---|---|---|---|
| Standard | 132.84 | 139.80 | 150.76 | 157.72 | 168.68 | 175.64 | 186.60 |
| Camarilla | 156.79 | 158.44 | 160.08 | 161.72 | 163.36 | 165.01 | 166.65 |
| Woodie | 134.84 | 140.80 | 152.76 | 158.72 | 170.68 | 176.64 | 188.60 |
| Fibonacci | 139.80 | 146.65 | 150.88 | 157.72 | 164.57 | 168.80 | 175.64 |
Numerical data
The following is the status of the technical indicators and moving averages at the time of publication of this technical analysis:
| RSI (14): | 78.23 | |
| MACD (12,26,9): | 7.4400 | |
| Directional Movement: | 29.05 | |
| AROON (14): | 100.00 | |
| DEMA (21): | 186.95 | |
| Parabolic SAR (0,02-0,02-0,2): | 182.23 | |
| Elder Ray (13): | 7.61 | |
| Super Trend (3,10): | 177.81 | |
| Zig ZAG (10): | 187.97 | |
| VORTEX (21): | 1.2300 | |
| Stochastique (14,3,5): | 95.41 | |
| TEMA (21): | 190.19 | |
| Williams %R (14): | -9.53 | |
| Chande Momentum Oscillator (20): | 8.87 | |
| Repulse (5,40,3): | 0.4500 | |
| ROCnROLL: | 1 | |
| TRIX (15,9): | 0.6000 | |
| Courbe Coppock: | 23.78 |
| MA7: | 184.99 | |
| MA20: | 175.97 | |
| MA50: | 162.89 | |
| MA100: | 157.22 | |
| MAexp7: | 185.28 | |
| MAexp20: | 177.48 | |
| MAexp50: | 167.52 | |
| MAexp100: | 161.45 | |
| Price / MA7: | +1.56% | |
| Price / MA20: | +6.77% | |
| Price / MA50: | +15.34% | |
| Price / MA100: | +19.50% | |
| Price / MAexp7: | +1.40% | |
| Price / MAexp20: | +5.86% | |
| Price / MAexp50: | +12.15% | |
| Price / MAexp100: | +16.37% |
News
The latest news and videos published on TAKE-TWO INTERACTIVE SOFTWARE at the time of the analysis were as follows:
- Thinking about trading options or stock in Kratos Defense & Security Solutions, Digital World Acquisition, Sea Ltd, On Holding, or TAKE-TWO INTERACTIVE SOFTWARE?
- Take-Two Interactive Software, Inc. Reports Results for Fiscal First Quarter 2024
- Take-Two Interactive Software, Inc. to Report First Quarter Fiscal Year 2024 Results on Tuesday, August 8, 2023
- Take-Two Interactive Software, Inc. Announces Pricing of Tender Offer for 3.300% Senior Notes Due 2024
- Take-Two Interactive Software, Inc. Announces Early Tender Results and Increase in Tender Cap for 3.300% Senior Notes Due 2024
About author
Online


Add a comment
Comments
0 comments on the analysis TAKE-TWO INTERACTIVE SOFTWARE - Daily