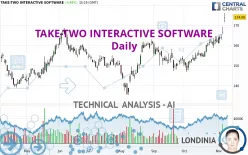
TAKE-TWO INTERACTIVE SOFTWARE - Daily - Technical analysis published on 11/07/2024 (GMT)
- 114
- 0
Click here for a new analysis!
- Timeframe : Daily
- - Analysis generated on
- Status : TARGET REACHED

Summary of the analysis

Additional analysis
Quotes
The TAKE-TWO INTERACTIVE SOFTWARE price is 174.09 USD. The price has increased by +4.48% since the last closing and was traded between 171.40 USD and 176.02 USD over the period. The price is currently at +1.57% from its lowest and -1.10% from its highest.A study of price movements over other periods shows the following variations:
New HIGH record (1 year)
Type : Bullish
Timeframe : Weekly
New HIGH record (1st january)
Type : Bullish
Timeframe : Weekly
New HIGH record (1 month)
Type : Bullish
Timeframe : Weekly
Technical
Technical analysis of TAKE-TWO INTERACTIVE SOFTWARE in Daily shows a strongly overall bullish trend. 92.86% of the signals given by moving averages are bullish. This strongly bullish trend is supported by the strong bullish signals given by short-term moving averages. The Central Indicators market scanner currently does not detect any result that concerns moving averages.
In fact, according to the parameters integrated into the Central Analyzer system, 16 technical indicators out of 18 analysed are currently bullish. Central Indicators, the detector scanner for these technical indicators recently detected a signal:
Pivot points : price is over resistance 3
Type : Neutral
Timeframe : Weekly
The Central Patterns scanner, which studies chart patterns, resistances and supports, has identified these signals:
Near horizontal resistance
Type : Bearish
Timeframe : Daily
Resistance of channel is broken
Type : Bullish
Timeframe : Daily
From the Japanese candlestick perspective, the Central Candlesticks scanner notes the presence of these results that could impact the short-term trend:
Upside gap
Type : Bullish
Timeframe : Daily
Doji
Type : Neutral
Timeframe : Daily
| S3 | S2 | S1 | Price | R1 | R2 | |
|---|---|---|---|---|---|---|
| ProTrendLines | 154.76 | 161.71 | 168.15 | 174.09 | 192.91 | 213.34 |
| Change (%) | -11.10% | -7.11% | -3.41% | - | +10.81% | +22.55% |
| Change | -19.33 | -12.38 | -5.94 | - | +18.82 | +39.25 |
| Level | Major | Minor | Major | - | Intermediate | Major |
Pivot points can also be used to set your price objectives. Here is the price situation in relation to pivot points:
| Pivot points | S3 | S2 | S1 | PP | R1 | R2 | R3 |
|---|---|---|---|---|---|---|---|
| Standard | 161.28 | 163.31 | 164.97 | 167.00 | 168.66 | 170.69 | 172.35 |
| Camarilla | 165.61 | 165.94 | 166.28 | 166.62 | 166.96 | 167.30 | 167.64 |
| Woodie | 161.09 | 163.22 | 164.78 | 166.91 | 168.47 | 170.60 | 172.16 |
| Fibonacci | 163.31 | 164.72 | 165.59 | 167.00 | 168.41 | 169.28 | 170.69 |
| Pivot points | S3 | S2 | S1 | PP | R1 | R2 | R3 |
|---|---|---|---|---|---|---|---|
| Standard | 154.03 | 156.34 | 160.06 | 162.37 | 166.09 | 168.40 | 172.12 |
| Camarilla | 162.12 | 162.68 | 163.23 | 163.78 | 164.33 | 164.89 | 165.44 |
| Woodie | 154.74 | 156.69 | 160.77 | 162.72 | 166.80 | 168.75 | 172.83 |
| Fibonacci | 156.34 | 158.64 | 160.07 | 162.37 | 164.67 | 166.10 | 168.40 |
| Pivot points | S3 | S2 | S1 | PP | R1 | R2 | R3 |
|---|---|---|---|---|---|---|---|
| Standard | 132.84 | 139.80 | 150.76 | 157.72 | 168.68 | 175.64 | 186.60 |
| Camarilla | 156.79 | 158.44 | 160.08 | 161.72 | 163.36 | 165.01 | 166.65 |
| Woodie | 134.84 | 140.80 | 152.76 | 158.72 | 170.68 | 176.64 | 188.60 |
| Fibonacci | 139.80 | 146.65 | 150.88 | 157.72 | 164.57 | 168.80 | 175.64 |
Numerical data
The following are the details of the technical indicators and moving averages that were collected to generate this technical analysis:
| RSI (14): | 80.89 | |
| MACD (12,26,9): | 3.6600 | |
| Directional Movement: | 31.77 | |
| AROON (14): | 92.86 | |
| DEMA (21): | 165.89 | |
| Parabolic SAR (0,02-0,02-0,2): | 162.62 | |
| Elder Ray (13): | 10.22 | |
| Super Trend (3,10): | 162.05 | |
| Zig ZAG (10): | 172.93 | |
| VORTEX (21): | 1.1800 | |
| Stochastique (14,3,5): | 86.00 | |
| TEMA (21): | 167.90 | |
| Williams %R (14): | -13.73 | |
| Chande Momentum Oscillator (20): | 13.01 | |
| Repulse (5,40,3): | -0.5200 | |
| ROCnROLL: | 1 | |
| TRIX (15,9): | 0.2400 | |
| Courbe Coppock: | 12.05 |
| MA7: | 165.13 | |
| MA20: | 160.68 | |
| MA50: | 156.33 | |
| MA100: | 153.94 | |
| MAexp7: | 166.16 | |
| MAexp20: | 161.64 | |
| MAexp50: | 157.52 | |
| MAexp100: | 155.35 | |
| Price / MA7: | +5.43% | |
| Price / MA20: | +8.35% | |
| Price / MA50: | +11.36% | |
| Price / MA100: | +13.09% | |
| Price / MAexp7: | +4.77% | |
| Price / MAexp20: | +7.70% | |
| Price / MAexp50: | +10.52% | |
| Price / MAexp100: | +12.06% |
News
Don't forget to follow the news on TAKE-TWO INTERACTIVE SOFTWARE. At the time of publication of this analysis, the latest news was as follows:
- Thinking about trading options or stock in Kratos Defense & Security Solutions, Digital World Acquisition, Sea Ltd, On Holding, or TAKE-TWO INTERACTIVE SOFTWARE?
- Take-Two Interactive Software, Inc. Reports Results for Fiscal First Quarter 2024
- Take-Two Interactive Software, Inc. to Report First Quarter Fiscal Year 2024 Results on Tuesday, August 8, 2023
- Take-Two Interactive Software, Inc. Announces Pricing of Tender Offer for 3.300% Senior Notes Due 2024
- Take-Two Interactive Software, Inc. Announces Early Tender Results and Increase in Tender Cap for 3.300% Senior Notes Due 2024
About author
Online


Add a comment
Comments
0 comments on the analysis TAKE-TWO INTERACTIVE SOFTWARE - Daily