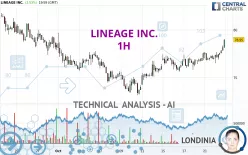
LINEAGE INC. - 1H - Technical analysis published on 10/23/2024 (GMT)
- 121
- 0
Click here for a new analysis!
- Timeframe : 1H
- - Analysis generated on
- Status : INVALID

Summary of the analysis

Additional analysis
Quotes
The LINEAGE INC. price is 78.95 USD. The price registered an increase of +2.53% on the session with the lowest point at 76.50 USD and the highest point at 79.00 USD. The deviation from the price is +3.20% for the low point and -0.06% for the high point.So that you have an overall view of the price change, here is a table showing the variations over several periods:
Near a new LOW record (5 years)
Type : Bearish
Timeframe : Weekly
Near a new LOW record (1 year)
Type : Bearish
Timeframe : Weekly
Near a new LOW record (1 month)
Type : Bearish
Timeframe : Weekly
Technical
Technical analysis of this 1H chart of LINEAGE INC. indicates that the overall trend is strongly bullish. The signals given by the moving averages are 89.29% bullish. This strong bullish trend is confirmed by the strong signals currently being given by short-term moving averages. The Central Indicators scanner does not detect any result on moving averages that would impact this trend.
In fact, 15 technical indicators on 18 studied are currently positioned bullish. Central Indicators, the scanner specialised in technical indicators, has identified these signals:
Pivot points : price is over resistance 1
Type : Neutral
Timeframe : Weekly
Pivot points : price is over resistance 3
Type : Neutral
Timeframe : 1 hour
The Central Patterns scanner, which studies chart patterns, resistances and supports, has identified these signals:
Near horizontal resistance
Type : Bearish
Timeframe : 1 hour
Resistance of channel is broken
Type : Bullish
Timeframe : 1 hour
The Central Candlesticks scanner, specialised in Japanese candlesticks, did not identify any signals.
| S3 | S2 | S1 | Price | R1 | R2 | R3 | |
|---|---|---|---|---|---|---|---|
| ProTrendLines | 74.50 | 75.68 | 77.42 | 78.95 | 79.65 | 81.79 | 83.33 |
| Change (%) | -5.64% | -4.14% | -1.94% | - | +0.89% | +3.60% | +5.55% |
| Change | -4.45 | -3.27 | -1.53 | - | +0.70 | +2.84 | +4.38 |
| Level | Minor | Intermediate | Major | - | Intermediate | Intermediate | Minor |
Attention could also be paid to pivot points to set price objectives:
| Pivot points | S3 | S2 | S1 | PP | R1 | R2 | R3 |
|---|---|---|---|---|---|---|---|
| Standard | 75.78 | 76.28 | 76.64 | 77.14 | 77.50 | 78.00 | 78.36 |
| Camarilla | 76.76 | 76.84 | 76.92 | 77.00 | 77.08 | 77.16 | 77.24 |
| Woodie | 75.71 | 76.25 | 76.57 | 77.11 | 77.43 | 77.97 | 78.29 |
| Fibonacci | 76.28 | 76.61 | 76.81 | 77.14 | 77.47 | 77.67 | 78.00 |
| Pivot points | S3 | S2 | S1 | PP | R1 | R2 | R3 |
|---|---|---|---|---|---|---|---|
| Standard | 73.34 | 74.22 | 75.88 | 76.76 | 78.42 | 79.30 | 80.96 |
| Camarilla | 76.85 | 77.08 | 77.32 | 77.55 | 77.78 | 78.02 | 78.25 |
| Woodie | 73.74 | 74.42 | 76.28 | 76.96 | 78.82 | 79.50 | 81.36 |
| Fibonacci | 74.22 | 75.19 | 75.79 | 76.76 | 77.73 | 78.33 | 79.30 |
| Pivot points | S3 | S2 | S1 | PP | R1 | R2 | R3 |
|---|---|---|---|---|---|---|---|
| Standard | 68.60 | 72.99 | 75.69 | 80.08 | 82.78 | 87.17 | 89.87 |
| Camarilla | 76.43 | 77.08 | 77.73 | 78.38 | 79.03 | 79.68 | 80.33 |
| Woodie | 67.75 | 72.57 | 74.84 | 79.66 | 81.93 | 86.75 | 89.02 |
| Fibonacci | 72.99 | 75.70 | 77.38 | 80.08 | 82.79 | 84.47 | 87.17 |
Numerical data
The following are the details of the technical indicators and moving averages that were collected to generate this technical analysis:
| RSI (14): | 73.65 | |
| MACD (12,26,9): | 0.4300 | |
| Directional Movement: | 20.31 | |
| AROON (14): | 42.86 | |
| DEMA (21): | 77.90 | |
| Parabolic SAR (0,02-0,02-0,2): | 76.70 | |
| Elder Ray (13): | 0.94 | |
| Super Trend (3,10): | 76.97 | |
| Zig ZAG (10): | 78.95 | |
| VORTEX (21): | 1.2100 | |
| Stochastique (14,3,5): | 95.14 | |
| TEMA (21): | 78.07 | |
| Williams %R (14): | -2.00 | |
| Chande Momentum Oscillator (20): | 2.11 | |
| Repulse (5,40,3): | 1.9700 | |
| ROCnROLL: | 1 | |
| TRIX (15,9): | 0.0500 | |
| Courbe Coppock: | 2.11 |
| MA7: | 77.03 | |
| MA20: | 76.62 | |
| MA50: | 80.44 | |
| MA100: | 0.00 | |
| MAexp7: | 77.94 | |
| MAexp20: | 77.39 | |
| MAexp50: | 76.84 | |
| MAexp100: | 76.90 | |
| Price / MA7: | +2.49% | |
| Price / MA20: | +3.04% | |
| Price / MA50: | -1.85% | |
| Price / MA100: | - | |
| Price / MAexp7: | +1.30% | |
| Price / MAexp20: | +2.02% | |
| Price / MAexp50: | +2.75% | |
| Price / MAexp100: | +2.67% |
About author
Online


Add a comment
Comments
0 comments on the analysis LINEAGE INC. - 1H