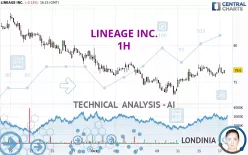
LINEAGE INC. - 1H - Technical analysis published on 10/17/2024 (GMT)
- 132
- 0
Click here for a new analysis!
- Timeframe : 1H
- - Analysis generated on
- Status : TARGET REACHED

Summary of the analysis

Additional analysis
Quotes
LINEAGE INC. rating 76.60 USD. The price registered a decrease of -0.13% on the session with the lowest point at 75.99 USD and the highest point at 77.42 USD. The deviation from the price is +0.80% for the low point and -1.06% for the high point.The Central Gaps scanner detects a bullish opening marking the presence of buyers ahead of sellers at the opening but not sufficiently marked to allow the price to register a quotation gap.
Bullish opening
Type : Bullish
Timeframe : Openning
A study of price movements over other periods shows the following variations:
Near a new LOW record (5 years)
Type : Bearish
Timeframe : Weekly
Near a new LOW record (1 year)
Type : Bearish
Timeframe : Weekly
Near a new LOW record (1 month)
Type : Bearish
Timeframe : Weekly
The Central Volumes scanner notes the presence of abnormal volumes:
Abnormal volumes
Timeframe : 20 days
Abnormal volumes
Timeframe : 50 days
Technical
A technical analysis in 1H of this LINEAGE INC. chart shows a slightly bullish trend. 53.57% of the signals given by moving averages are bullish. The slightly bullish signals given by short-term moving averages do not show a strengthening of this global trend. The Central Indicators market scanner is currently detecting a bearish signal that could impact this trend:
Bearish price crossover with Moving Average 100
Type : Bearish
Timeframe : 1 hour
An assessment of technical indicators does not currently provide any relevant information on the direction of future price movements.
The Central Indicators scanner found no further results concerning independent technical indicators.
Central Patterns, the scanner specializing in chart patterns, did not identify any signals.
The Central Candlesticks scanner which studies Japanese candlesticks did not detect anything.
| S3 | S2 | S1 | Price | R1 | R2 | R3 | |
|---|---|---|---|---|---|---|---|
| ProTrendLines | 73.16 | 74.50 | 75.72 | 76.60 | 77.42 | 79.65 | 82.85 |
| Change (%) | -4.49% | -2.74% | -1.15% | - | +1.07% | +3.98% | +8.16% |
| Change | -3.44 | -2.10 | -0.88 | - | +0.82 | +3.05 | +6.25 |
| Level | Intermediate | Minor | Intermediate | - | Intermediate | Intermediate | Minor |
Attention could also be paid to pivot points to set price objectives:
| Pivot points | S3 | S2 | S1 | PP | R1 | R2 | R3 |
|---|---|---|---|---|---|---|---|
| Standard | 74.59 | 75.11 | 75.90 | 76.42 | 77.21 | 77.73 | 78.52 |
| Camarilla | 76.34 | 76.46 | 76.58 | 76.70 | 76.82 | 76.94 | 77.06 |
| Woodie | 74.74 | 75.18 | 76.05 | 76.49 | 77.36 | 77.80 | 78.67 |
| Fibonacci | 75.11 | 75.61 | 75.92 | 76.42 | 76.92 | 77.23 | 77.73 |
| Pivot points | S3 | S2 | S1 | PP | R1 | R2 | R3 |
|---|---|---|---|---|---|---|---|
| Standard | 69.51 | 71.34 | 73.30 | 75.13 | 77.09 | 78.92 | 80.88 |
| Camarilla | 74.23 | 74.58 | 74.92 | 75.27 | 75.62 | 75.97 | 76.31 |
| Woodie | 69.59 | 71.37 | 73.38 | 75.16 | 77.17 | 78.95 | 80.96 |
| Fibonacci | 71.34 | 72.78 | 73.68 | 75.13 | 76.57 | 77.47 | 78.92 |
| Pivot points | S3 | S2 | S1 | PP | R1 | R2 | R3 |
|---|---|---|---|---|---|---|---|
| Standard | 68.60 | 72.99 | 75.69 | 80.08 | 82.78 | 87.17 | 89.87 |
| Camarilla | 76.43 | 77.08 | 77.73 | 78.38 | 79.03 | 79.68 | 80.33 |
| Woodie | 67.75 | 72.57 | 74.84 | 79.66 | 81.93 | 86.75 | 89.02 |
| Fibonacci | 72.99 | 75.70 | 77.38 | 80.08 | 82.79 | 84.47 | 87.17 |
Numerical data
The following are the details of the technical indicators and moving averages that were collected to generate this technical analysis:
| RSI (14): | 51.01 | |
| MACD (12,26,9): | 0.1800 | |
| Directional Movement: | 2.60 | |
| AROON (14): | 21.43 | |
| DEMA (21): | 76.52 | |
| Parabolic SAR (0,02-0,02-0,2): | 75.73 | |
| Elder Ray (13): | -0.15 | |
| Super Trend (3,10): | 75.21 | |
| Zig ZAG (10): | 76.22 | |
| VORTEX (21): | 0.9900 | |
| Stochastique (14,3,5): | 37.22 | |
| TEMA (21): | 76.57 | |
| Williams %R (14): | -57.38 | |
| Chande Momentum Oscillator (20): | -0.52 | |
| Repulse (5,40,3): | 0.1200 | |
| ROCnROLL: | 1 | |
| TRIX (15,9): | 0.0500 | |
| Courbe Coppock: | 0.59 |
| MA7: | 75.60 | |
| MA20: | 76.94 | |
| MA50: | 80.99 | |
| MA100: | 0.00 | |
| MAexp7: | 76.38 | |
| MAexp20: | 76.25 | |
| MAexp50: | 76.06 | |
| MAexp100: | 76.68 | |
| Price / MA7: | +1.32% | |
| Price / MA20: | -0.44% | |
| Price / MA50: | -5.42% | |
| Price / MA100: | - | |
| Price / MAexp7: | +0.29% | |
| Price / MAexp20: | +0.46% | |
| Price / MAexp50: | +0.71% | |
| Price / MAexp100: | -0.10% |
About author
Online


Add a comment
Comments
0 comments on the analysis LINEAGE INC. - 1H