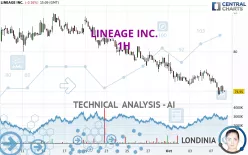
LINEAGE INC. - 1H - Technical analysis published on 10/08/2024 (GMT)
- 125
- 0
Click here for a new analysis!
- Timeframe : 1H
- - Analysis generated on
- Status : TARGET REACHED

Summary of the analysis

Additional analysis
Quotes
The LINEAGE INC. rating is 74.95 USD. The price registered a decrease of -0.16% on the session and was traded between 74.78 USD and 75.74 USD over the period. The price is currently at +0.23% from its lowest and -1.04% from its highest.A bearish opening was detected by the Central Gaps scanner. Sellers are trying to impose a bearish trend in the very short term.
Bearish opening
Type : Bearish
Timeframe : Openning
A study of price movements over other periods shows the following variations:
New LOW record (5 years)
Type : Bearish
Timeframe : Weekly
Near a new LOW record (1 year)
Type : Bearish
Timeframe : Weekly
Near a new LOW record (1 month)
Type : Bearish
Timeframe : Weekly
The Central Volumes scanner notes the presence of abnormal volumes:
Abnormal volumes
Timeframe : 5 days
Abnormal volumes
Timeframe : 20 days
Abnormal volumes
Timeframe : 50 days
Technical
A technical analysis in 1H of this LINEAGE INC. chart shows a sharp bearish trend. 92.86% of the signals given by moving averages are bearish. This strongly bearish trend is supported by the strong bearish signals given by short-term moving averages. There is no crossing of moving average by the price or crossing of moving averages between themselves.
An assessment of technical indicators does not currently provide any relevant information to suggest whether the signal given by the technical indicators is more bullish or bearish.
But beware of excesses. The Central Indicators scanner currently detects this:
CCI indicator is oversold : under -100
Type : Neutral
Timeframe : 1 hour
CCI indicator: bullish divergence
Type : Bullish
Timeframe : 1 hour
Williams %R indicator is oversold : under -80
Type : Neutral
Timeframe : 1 hour
Pivot points : price is under support 1
Type : Neutral
Timeframe : Weekly
Central Patterns, the market scanner focusing on chart patterns, resistances and supports found this result:
Near horizontal resistance
Type : Bearish
Timeframe : 1 hour
The Central Candlesticks scanner, specialised in Japanese candlesticks, did not identify any signals.
| Price | R1 | R2 | R3 | |
|---|---|---|---|---|
| ProTrendLines | 74.95 | 75.73 | 79.64 | 81.76 |
| Change (%) | - | +1.04% | +6.26% | +9.09% |
| Change | - | +0.78 | +4.69 | +6.81 |
| Level | - | Minor | Intermediate | Minor |
Pivot points can also be used to set your price objectives. Here is the price situation in relation to pivot points:
| Pivot points | S3 | S2 | S1 | PP | R1 | R2 | R3 |
|---|---|---|---|---|---|---|---|
| Standard | 71.61 | 73.06 | 74.06 | 75.51 | 76.51 | 77.96 | 78.96 |
| Camarilla | 74.40 | 74.62 | 74.85 | 75.07 | 75.30 | 75.52 | 75.74 |
| Woodie | 71.40 | 72.95 | 73.85 | 75.40 | 76.30 | 77.85 | 78.75 |
| Fibonacci | 73.06 | 73.99 | 74.57 | 75.51 | 76.44 | 77.02 | 77.96 |
| Pivot points | S3 | S2 | S1 | PP | R1 | R2 | R3 |
|---|---|---|---|---|---|---|---|
| Standard | 71.25 | 73.49 | 75.18 | 77.42 | 79.11 | 81.35 | 83.04 |
| Camarilla | 75.79 | 76.15 | 76.51 | 76.87 | 77.23 | 77.59 | 77.95 |
| Woodie | 70.98 | 73.35 | 74.91 | 77.28 | 78.84 | 81.21 | 82.77 |
| Fibonacci | 73.49 | 74.99 | 75.92 | 77.42 | 78.92 | 79.85 | 81.35 |
| Pivot points | S3 | S2 | S1 | PP | R1 | R2 | R3 |
|---|---|---|---|---|---|---|---|
| Standard | 68.60 | 72.99 | 75.69 | 80.08 | 82.78 | 87.17 | 89.87 |
| Camarilla | 76.43 | 77.08 | 77.73 | 78.38 | 79.03 | 79.68 | 80.33 |
| Woodie | 67.75 | 72.57 | 74.84 | 79.66 | 81.93 | 86.75 | 89.02 |
| Fibonacci | 72.99 | 75.70 | 77.38 | 80.08 | 82.79 | 84.47 | 87.17 |
Numerical data
The following are the details of the technical indicators and moving averages that were collected to generate this technical analysis:
| RSI (14): | 41.85 | |
| MACD (12,26,9): | -0.4800 | |
| Directional Movement: | -15.32 | |
| AROON (14): | -57.14 | |
| DEMA (21): | 75.59 | |
| Parabolic SAR (0,02-0,02-0,2): | 77.02 | |
| Elder Ray (13): | -0.32 | |
| Super Trend (3,10): | 77.11 | |
| Zig ZAG (10): | 75.63 | |
| VORTEX (21): | 0.9400 | |
| Stochastique (14,3,5): | 28.58 | |
| TEMA (21): | 75.41 | |
| Williams %R (14): | -76.99 | |
| Chande Momentum Oscillator (20): | -2.13 | |
| Repulse (5,40,3): | -0.5500 | |
| ROCnROLL: | 2 | |
| TRIX (15,9): | -0.0700 | |
| Courbe Coppock: | 3.66 |
| MA7: | 76.43 | |
| MA20: | 79.22 | |
| MA50: | 82.44 | |
| MA100: | 0.00 | |
| MAexp7: | 75.56 | |
| MAexp20: | 76.21 | |
| MAexp50: | 77.12 | |
| MAexp100: | 78.45 | |
| Price / MA7: | -1.94% | |
| Price / MA20: | -5.39% | |
| Price / MA50: | -9.09% | |
| Price / MA100: | - | |
| Price / MAexp7: | -0.81% | |
| Price / MAexp20: | -1.65% | |
| Price / MAexp50: | -2.81% | |
| Price / MAexp100: | -4.46% |
About author
Online


Add a comment
Comments
0 comments on the analysis LINEAGE INC. - 1H