T. ROWE PRICE GROUP INC. - 1H - Technical analysis published on 12/16/2024 (GMT)
- 96
- 0
Click here for a new analysis!
- Timeframe : 1H
- - Analysis generated on
- Status : TARGET REACHED
Summary of the analysis

Additional analysis
Quotes
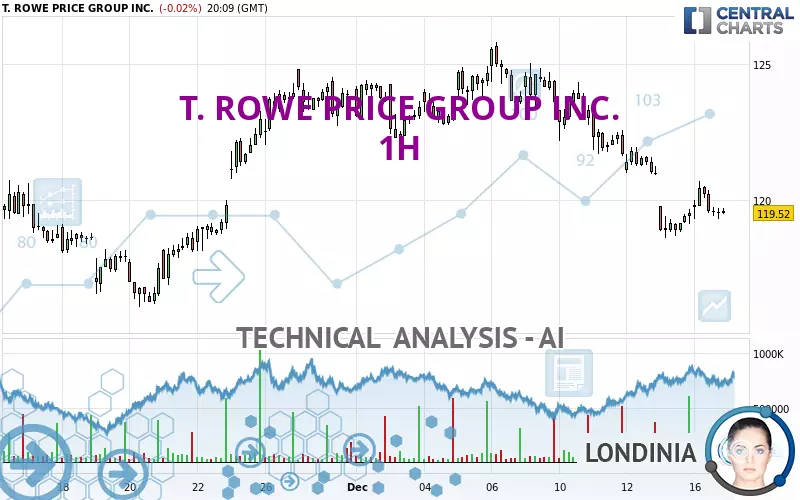
The T. ROWE PRICE GROUP INC. rating is 119.52 USD. The price is lower by -0.02% since the last closing with the lowest point at 119.31 USD and the highest point at 120.71 USD. The deviation from the price is +0.18% for the low point and -0.99% for the high point.The Central Gaps scanner detects a bullish opening. A small advantage for buyers in the very short term.
Bullish opening
Type : Bullish
Timeframe : Openning
Here is a more detailed summary of the historical variations registered by T. ROWE PRICE GROUP INC.:
Near a new HIGH record (1 year)
Type : Bullish
Timeframe : Weekly
Near a new HIGH record (1st january)
Type : Bullish
Timeframe : Weekly
Near a new LOW record (1 month)
Type : Bearish
Timeframe : Weekly
Technical
Technical analysis of T. ROWE PRICE GROUP INC. in 1H shows a overall strongly bearish trend. 89.29% of the signals given by moving averages are bearish. The overall trend is supported by the strong bearish signals from short-term moving averages. The Central Indicators scanner detects a bearish signal on moving averages that could impact this trend:
Bearish trend reversal : Moving Average 100
Type : Bearish
Timeframe : 1 hour
An assessment of technical indicators does not currently provide any relevant information to suggest whether the signal given by the technical indicators is more bullish or bearish.
Central Indicators, the detector scanner for these technical indicators recently detected a signal:
Momentum indicator is back over 0
Type : Bullish
Timeframe : 1 hour
Central Patterns, the market scanner focusing on chart patterns, resistances and supports found this result:
Near resistance of channel
Type : Bearish
Timeframe : 1 hour
For a small setback in the very short term, the Central Candlesticks scanner currently notes the presence of this bearish pattern in Japanese candlesticks:
Three black crows
Type : Bearish
Timeframe : 1 hour
| S3 | S2 | S1 | Price | R1 | R2 | R3 | |
|---|---|---|---|---|---|---|---|
| ProTrendLines | 114.43 | 116.21 | 118.23 | 119.52 | 120.07 | 121.43 | 123.41 |
| Change (%) | -4.26% | -2.77% | -1.08% | - | +0.46% | +1.60% | +3.25% |
| Change | -5.09 | -3.31 | -1.29 | - | +0.55 | +1.91 | +3.89 |
| Level | Intermediate | Intermediate | Major | - | Major | Intermediate | Intermediate |
Attention could also be paid to pivot points to set price objectives:
| Pivot points | S3 | S2 | S1 | PP | R1 | R2 | R3 |
|---|---|---|---|---|---|---|---|
| Standard | 117.69 | 118.15 | 118.85 | 119.31 | 120.01 | 120.47 | 121.17 |
| Camarilla | 119.22 | 119.33 | 119.43 | 119.54 | 119.65 | 119.75 | 119.86 |
| Woodie | 117.80 | 118.21 | 118.96 | 119.37 | 120.12 | 120.53 | 121.28 |
| Fibonacci | 118.15 | 118.60 | 118.87 | 119.31 | 119.76 | 120.03 | 120.47 |
| Pivot points | S3 | S2 | S1 | PP | R1 | R2 | R3 |
|---|---|---|---|---|---|---|---|
| Standard | 112.38 | 115.50 | 117.52 | 120.64 | 122.66 | 125.78 | 127.80 |
| Camarilla | 118.13 | 118.60 | 119.07 | 119.54 | 120.01 | 120.48 | 120.95 |
| Woodie | 111.83 | 115.23 | 116.97 | 120.37 | 122.11 | 125.51 | 127.25 |
| Fibonacci | 115.50 | 117.46 | 118.68 | 120.64 | 122.60 | 123.82 | 125.78 |
| Pivot points | S3 | S2 | S1 | PP | R1 | R2 | R3 |
|---|---|---|---|---|---|---|---|
| Standard | 96.15 | 101.82 | 112.20 | 117.87 | 128.25 | 133.92 | 144.30 |
| Camarilla | 118.16 | 119.63 | 121.10 | 122.57 | 124.04 | 125.51 | 126.98 |
| Woodie | 98.50 | 103.00 | 114.55 | 119.05 | 130.60 | 135.10 | 146.65 |
| Fibonacci | 101.82 | 107.95 | 111.74 | 117.87 | 124.00 | 127.79 | 133.92 |
Numerical data
The following are the details of the technical indicators and moving averages that were collected to generate this technical analysis:
| RSI (14): | 43.80 | |
| MACD (12,26,9): | -0.3900 | |
| Directional Movement: | -7.19 | |
| AROON (14): | 50.00 | |
| DEMA (21): | 119.33 | |
| Parabolic SAR (0,02-0,02-0,2): | 119.31 | |
| Elder Ray (13): | -0.12 | |
| Super Trend (3,10): | 120.78 | |
| Zig ZAG (10): | 119.56 | |
| VORTEX (21): | 0.8900 | |
| Stochastique (14,3,5): | 45.96 | |
| TEMA (21): | 119.40 | |
| Williams %R (14): | -55.88 | |
| Chande Momentum Oscillator (20): | 0.62 | |
| Repulse (5,40,3): | -0.3600 | |
| ROCnROLL: | 2 | |
| TRIX (15,9): | -0.0700 | |
| Courbe Coppock: | 0.35 |
| MA7: | 120.85 | |
| MA20: | 120.58 | |
| MA50: | 115.43 | |
| MA100: | 110.38 | |
| MAexp7: | 119.70 | |
| MAexp20: | 119.94 | |
| MAexp50: | 120.68 | |
| MAexp100: | 120.56 | |
| Price / MA7: | -1.10% | |
| Price / MA20: | -0.88% | |
| Price / MA50: | +3.54% | |
| Price / MA100: | +8.28% | |
| Price / MAexp7: | -0.15% | |
| Price / MAexp20: | -0.35% | |
| Price / MAexp50: | -0.96% | |
| Price / MAexp100: | -0.86% |
News
The latest news and videos published on T. ROWE PRICE GROUP INC. at the time of the analysis were as follows:
- T. Rowe Price Receives Local, National, and Global Recognition for Fostering a Positive Workplace Culture
- T. ROWE PRICE GROUP REPORTS PRELIMINARY MONTH-END ASSETS UNDER MANAGEMENT FOR NOVEMBER 2024
- OHA is Administrative Agent & Lead Left Arranger for Private Refinancing of FloWorks
- T. ROWE PRICE'S ACCLAIMED 'CONFIDENT CONVERSATIONS® ON RETIREMENT' PODCAST ENTERS ITS FOURTH SEASON
- T. ROWE PRICE 'DRIVES' AWARENESS TO ACTIVE ETFs IN SAN FRANCISCO
About author
Online


Add a comment
Comments
0 comments on the analysis T. ROWE PRICE GROUP INC. - 1H