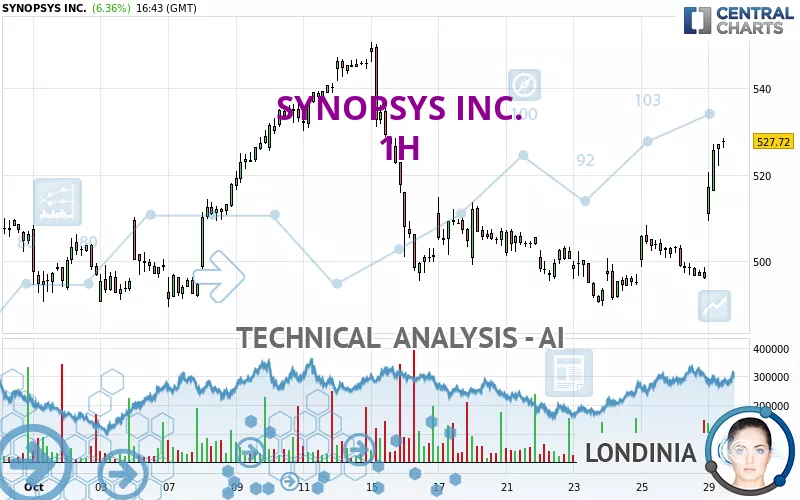
SYNOPSYS INC. - 1H - Technical analysis published on 10/29/2024 (GMT)
- 112
- 0
Click here for a new analysis!
- Timeframe : 1H
- - Analysis generated on
- Status : LEVEL MAINTAINED

Summary of the analysis

Additional analysis
Quotes
The SYNOPSYS INC. price is 527.72 USD. The price registered an increase of +6.36% on the session and was traded between 509.35 USD and 528.42 USD over the period. The price is currently at +3.61% from its lowest and -0.13% from its highest.A bullish gap was detected at the opening by the Central Gaps scanner. There are a lot of buyers and they have the upper hand in the very short term.
Opening Gap UP
Type : Bullish
Timeframe : Openning
A study of price movements over other periods shows the following variations:
Near a new HIGH record (1 month)
Type : Bullish
Timeframe : Weekly
Technical
Technical analysis of SYNOPSYS INC. in 1H shows a strongly overall bullish trend. The signals given by the moving averages are 82.14% bullish. This strong bullish trend is confirmed by the strong signals currently being given by short-term moving averages. The Central Indicators scanner does not detect any result on moving averages that would impact this trend.
In fact, 16 technical indicators on 18 studied are currently bullish. But beware of excesses. The Central Indicators scanner currently detects this:
RSI indicator is overbought : over 70
Type : Neutral
Timeframe : 1 hour
CCI indicator is overbought : over 100
Type : Neutral
Timeframe : 1 hour
Previous candle closed over Bollinger bands
Type : Neutral
Timeframe : 1 hour
Williams %R indicator is overbought : over -20
Type : Neutral
Timeframe : 1 hour
Pivot points : price is over resistance 2
Type : Neutral
Timeframe : Weekly
Pivot points : price is over resistance 3
Type : Neutral
Timeframe : 1 hour
The Central Patterns scanner, which studies chart patterns, resistances and supports, has identified these signals:
Near horizontal resistance
Type : Bearish
Timeframe : 1 hour
Resistance of channel is broken
Type : Bullish
Timeframe : 1 hour
No result was found by the Central Candlesticks scanner on Japanese candlesticks.
| S3 | S2 | S1 | Price | R1 | R2 | R3 | |
|---|---|---|---|---|---|---|---|
| ProTrendLines | 494.81 | 510.71 | 525.49 | 527.72 | 545.38 | 550.59 | 566.39 |
| Change (%) | -6.24% | -3.22% | -0.42% | - | +3.35% | +4.33% | +7.33% |
| Change | -32.91 | -17.01 | -2.23 | - | +17.66 | +22.87 | +38.67 |
| Level | Major | Major | Minor | - | Intermediate | Intermediate | Intermediate |
To determine price objectives, it is also possible to use the pivot points. Here is the price position in relation to pivot points:
| Pivot points | S3 | S2 | S1 | PP | R1 | R2 | R3 |
|---|---|---|---|---|---|---|---|
| Standard | 485.68 | 490.79 | 493.49 | 498.60 | 501.30 | 506.41 | 509.11 |
| Camarilla | 494.03 | 494.75 | 495.46 | 496.18 | 496.90 | 497.61 | 498.33 |
| Woodie | 484.47 | 490.19 | 492.28 | 498.00 | 500.09 | 505.81 | 507.90 |
| Fibonacci | 490.79 | 493.78 | 495.62 | 498.60 | 501.59 | 503.43 | 506.41 |
| Pivot points | S3 | S2 | S1 | PP | R1 | R2 | R3 |
|---|---|---|---|---|---|---|---|
| Standard | 472.86 | 481.31 | 491.45 | 499.90 | 510.04 | 518.49 | 528.63 |
| Camarilla | 496.47 | 498.17 | 499.88 | 501.58 | 503.28 | 504.99 | 506.69 |
| Woodie | 473.70 | 481.73 | 492.29 | 500.32 | 510.88 | 518.91 | 529.47 |
| Fibonacci | 481.31 | 488.42 | 492.80 | 499.90 | 507.01 | 511.39 | 518.49 |
| Pivot points | S3 | S2 | S1 | PP | R1 | R2 | R3 |
|---|---|---|---|---|---|---|---|
| Standard | 399.47 | 428.50 | 467.44 | 496.47 | 535.41 | 564.44 | 603.38 |
| Camarilla | 487.70 | 493.93 | 500.16 | 506.39 | 512.62 | 518.85 | 525.08 |
| Woodie | 404.44 | 430.98 | 472.41 | 498.95 | 540.38 | 566.92 | 608.35 |
| Fibonacci | 428.50 | 454.46 | 470.50 | 496.47 | 522.43 | 538.47 | 564.44 |
Numerical data
The following is the status of technical indicators and moving averages registered at the time this technical analysis was created:
| RSI (14): | 75.27 | |
| MACD (12,26,9): | 5.3300 | |
| Directional Movement: | 32.11 | |
| AROON (14): | 28.57 | |
| DEMA (21): | 513.00 | |
| Parabolic SAR (0,02-0,02-0,2): | 498.36 | |
| Elder Ray (13): | 16.69 | |
| Super Trend (3,10): | 511.35 | |
| Zig ZAG (10): | 527.02 | |
| VORTEX (21): | 1.1700 | |
| Stochastique (14,3,5): | 97.07 | |
| TEMA (21): | 518.92 | |
| Williams %R (14): | -3.41 | |
| Chande Momentum Oscillator (20): | 23.94 | |
| Repulse (5,40,3): | 1.6100 | |
| ROCnROLL: | 1 | |
| TRIX (15,9): | 0.0600 | |
| Courbe Coppock: | 5.06 |
| MA7: | 503.06 | |
| MA20: | 510.17 | |
| MA50: | 507.33 | |
| MA100: | 539.70 | |
| MAexp7: | 516.70 | |
| MAexp20: | 507.72 | |
| MAexp50: | 505.45 | |
| MAexp100: | 506.88 | |
| Price / MA7: | +4.90% | |
| Price / MA20: | +3.44% | |
| Price / MA50: | +4.02% | |
| Price / MA100: | -2.22% | |
| Price / MAexp7: | +2.13% | |
| Price / MAexp20: | +3.94% | |
| Price / MAexp50: | +4.41% | |
| Price / MAexp100: | +4.11% |
News
Don't forget to follow the news on SYNOPSYS INC.. At the time of publication of this analysis, the latest news was as follows:
- Synopsys and TSMC Pave the Path for Trillion-Transistor AI and Multi-Die Chip Design
- Synopsys Enters Definitive Agreement with Keysight Technologies For Sale of Optical Solutions Group
- Synopsys Advances Imaging System Development with Industry's First Complete Virtual Prototyping Platform
- Synopsys Powers World's Fastest UCIe-Based Multi-Die Designs with New IP Operating at 40 Gbps
- Synopsys Posts Financial Results for Third Quarter Fiscal Year 2024
About author
Online


Add a comment
Comments
0 comments on the analysis SYNOPSYS INC. - 1H