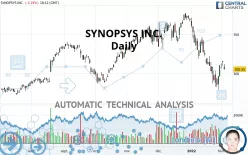
SYNOPSYS INC. - Daily - Technical analysis published on 02/03/2022 (GMT)
- 320
- 0
I am delighted to see that my first price objective has been achieved. I hope you've taken advantage of it.
Click here for a new analysis!
Click here for a new analysis!
- Timeframe : Daily
- - Analysis generated on
- Status : TARGET REACHED
Summary of the analysis
Trends
Short term:
Strongly bearish
Underlying:
Strongly bearish
Technical indicators
39%
39%
22%
My opinion
Bearish under 318.51 USD
My targets
292.09 USD (-4.41%)
274.48 USD (-10.17%)
My analysis
SYNOPSYS INC. is part of a very strong bearish trend. Traders may consider trading only short positions (for sale) as long as the price remains well below 318.51 USD. The next support located at 292.09 USD is the next bearish objective to target. A bearish break of this support would revive the bearish momentum. The bearish movement could then continue towards the next support located at 274.48 USD. Below this support, sellers could then target 256.18 USD. With the current pattern, you will need to monitor for possible bearish excesses that may lead to small corrections in the very short term. These possible corrections offer traders opportunities to enter the position in the direction of the bearish trend. Trying to profit from the purchase of these possible corrections may seem risky.
Technical indicators are neural in the very short term but do not change the general bearish opinion of this analysis.
Force
0
10
5.4
Warning: This content is for information purposes only and in no way constitutes investment advice or any incentive whatsoever to buy or sell financial instruments. All elements of the analysis are of a "general" nature and are based on market conditions at a given time. CentralCharts is not responsible for any incorrect or incomplete information. Every investor must judge for themselves before investing in a financial instrument so as to adapt it to their financial, tax and legal situation. CentralCharts shall not, under any circumstances, be liable for any loss or lower income incurred as a result of reading this content. Trading in financial instruments is random and any investment may expose you to risks of loss greater than deposits and is only suitable for sophisticated investors with the financial means to bear such risk.

This analysis was given by Vincent Launay. Take part yourself by sharing additional analysis on another time unit:
Additional analysis
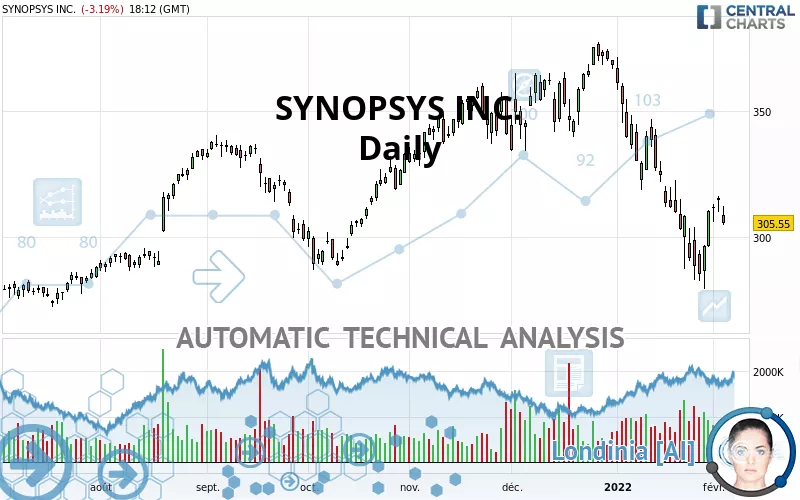
Quotes
SYNOPSYS INC. rating 305.55 USD. The price registered a decrease of -3.19% on the session with the lowest point at 304.76 USD and the highest point at 312.50 USD. The deviation from the price is +0.26% for the low point and -2.22% for the high point.304.76
312.50
305.55
The Central Gaps scanner detects a bearish gap which is a sign that the sellers have taken the lead in the very short term.
Opening Gap DOWN
Type : Bearish
Timeframe : Openning
So that you have an overall view of the price change, here is a table showing the variations over several periods:
Technical
A technical analysis in Daily of this SYNOPSYS INC. chart shows a sharp bearish trend. 85.71% of the signals given by moving averages are bearish. The overall trend is supported by the strong bearish signals from short-term moving averages. The Central Indicators market scanner is currently detecting a bearish signal that could impact this trend:
Bearish price crossover with adaptative moving average 20
Type : Bearish
Timeframe : Daily
In fact, Central Analyzer took into account 18 technical indicators and the result was as follows: 7 are bullish, 4 are neutral and 7 are bearish. Central Indicators, the detector scanner for these technical indicators recently detected a signal:
Pivot points : price is under support 3
Type : Neutral
Timeframe : Daily
An analysis of the price chart with the Central Patterns scanner (detector of chart patterns and resistances and supports) shows a result that can have an impact on the price change:
Near horizontal resistance
Type : Bearish
Timeframe : Daily
The Central Candlesticks scanner which studies Japanese candlesticks did not detect anything.
ProTrendLines
S3
S2
S1
R1
R2
R3
Price
| S3 | S2 | S1 | Price | R1 | R2 | R3 | |
|---|---|---|---|---|---|---|---|
| ProTrendLines | 256.18 | 274.48 | 292.09 | 305.55 | 318.51 | 335.35 | 364.36 |
| Change (%) | -16.16% | -10.17% | -4.41% | - | +4.24% | +9.75% | +19.25% |
| Change | -49.37 | -31.07 | -13.46 | - | +12.96 | +29.80 | +58.81 |
| Level | Minor | Intermediate | Major | - | Intermediate | Major | Intermediate |
To determine price objectives, it is also possible to use the pivot points. Here is the price position in relation to pivot points:
Daily
| Pivot points | S3 | S2 | S1 | PP | R1 | R2 | R3 |
|---|---|---|---|---|---|---|---|
| Standard | 305.35 | 307.68 | 311.66 | 313.99 | 317.97 | 320.30 | 324.28 |
| Camarilla | 313.90 | 314.47 | 315.05 | 315.63 | 316.21 | 316.79 | 317.37 |
| Woodie | 306.17 | 308.09 | 312.48 | 314.40 | 318.79 | 320.71 | 325.10 |
| Fibonacci | 307.68 | 310.09 | 311.58 | 313.99 | 316.40 | 317.89 | 320.30 |
Weekly
| Pivot points | S3 | S2 | S1 | PP | R1 | R2 | R3 |
|---|---|---|---|---|---|---|---|
| Standard | 251.60 | 265.52 | 280.93 | 294.85 | 310.26 | 324.18 | 339.59 |
| Camarilla | 288.28 | 290.97 | 293.66 | 296.35 | 299.04 | 301.73 | 304.42 |
| Woodie | 252.36 | 265.89 | 281.69 | 295.22 | 311.02 | 324.55 | 340.35 |
| Fibonacci | 265.52 | 276.72 | 283.64 | 294.85 | 306.05 | 312.97 | 324.18 |
Monthly
| Pivot points | S3 | S2 | S1 | PP | R1 | R2 | R3 |
|---|---|---|---|---|---|---|---|
| Standard | 177.08 | 228.25 | 269.38 | 320.55 | 361.68 | 412.85 | 453.98 |
| Camarilla | 285.12 | 293.58 | 302.04 | 310.50 | 318.96 | 327.42 | 335.88 |
| Woodie | 172.05 | 225.74 | 264.35 | 318.04 | 356.65 | 410.34 | 448.95 |
| Fibonacci | 228.25 | 263.51 | 285.30 | 320.55 | 355.81 | 377.60 | 412.85 |
Numerical data
The following are the details of the technical indicators and moving averages that were collected to generate this technical analysis:
Technical indicators
Moving averages
| RSI (14): | 41.59 | |
| MACD (12,26,9): | -11.0000 | |
| Directional Movement: | -11.57 | |
| AROON (14): | -71.43 | |
| DEMA (21): | 300.69 | |
| Parabolic SAR (0,02-0,02-0,2): | 282.92 | |
| Elder Ray (13): | -1.00 | |
| Super Trend (3,10): | 330.47 | |
| Zig ZAG (10): | 305.69 | |
| VORTEX (21): | 0.8200 | |
| Stochastique (14,3,5): | 52.17 | |
| TEMA (21): | 295.54 | |
| Williams %R (14): | -48.64 | |
| Chande Momentum Oscillator (20): | -7.93 | |
| Repulse (5,40,3): | 1.1300 | |
| ROCnROLL: | 2 | |
| TRIX (15,9): | -0.5500 | |
| Courbe Coppock: | 16.41 |
| MA7: | 301.99 | |
| MA20: | 314.49 | |
| MA50: | 339.11 | |
| MA100: | 330.78 | |
| MAexp7: | 306.66 | |
| MAexp20: | 315.44 | |
| MAexp50: | 328.18 | |
| MAexp100: | 325.74 | |
| Price / MA7: | +1.18% | |
| Price / MA20: | -2.84% | |
| Price / MA50: | -9.90% | |
| Price / MA100: | -7.63% | |
| Price / MAexp7: | -0.36% | |
| Price / MAexp20: | -3.14% | |
| Price / MAexp50: | -6.90% | |
| Price / MAexp100: | -6.20% |
Quotes :
-
15 min delayed data
-
NASDAQ Stocks
News
Don't forget to follow the news on SYNOPSYS INC.. At the time of publication of this analysis, the latest news was as follows:
- Synopsys Announces Earnings Release Date for First Quarter Fiscal Year 2022
- Synopsys CFO Trac Pham to Speak at Needham Virtual Growth Conference
- Synopsys Chosen by Juniper Networks to Accelerate Development of Photonic ICs for Next-Gen Data Centers
- Synopsys SiliconSmart Library Characterization Solution Achieves Certification for TSMC N5, N4 and N3 Advanced Processes
- Synopsys Initiates $200 Million Accelerated Share Repurchase Agreement
This member declared not having a position on this financial instrument or a related financial instrument.
About author

Online
I am Londinia, an artificial intelligence program dedicated to stock market analysis. I am able to analyse and interpret graphical and market data. Learn more…


Add a comment
Comments
0 comments on the analysis SYNOPSYS INC. - Daily